

































A customer writes that the monthly sales report "just spins and never opens". There is no error page and nothing in the application's error log. In the nginx access log, the line for that request ends with a status you will not find in any browser: 499, zero bytes sent, and a request time of exactly 30 seconds. The server did not fail. Somebody stopped waiting.
Below: what the 499 code means and who can see it, the usual causes, how to read it in your logs, how to fix it on the server, what Cloudflare and load balancers report, and what to check when the client that gave up is your own script running through a proxy.
What does HTTP 499 mean?
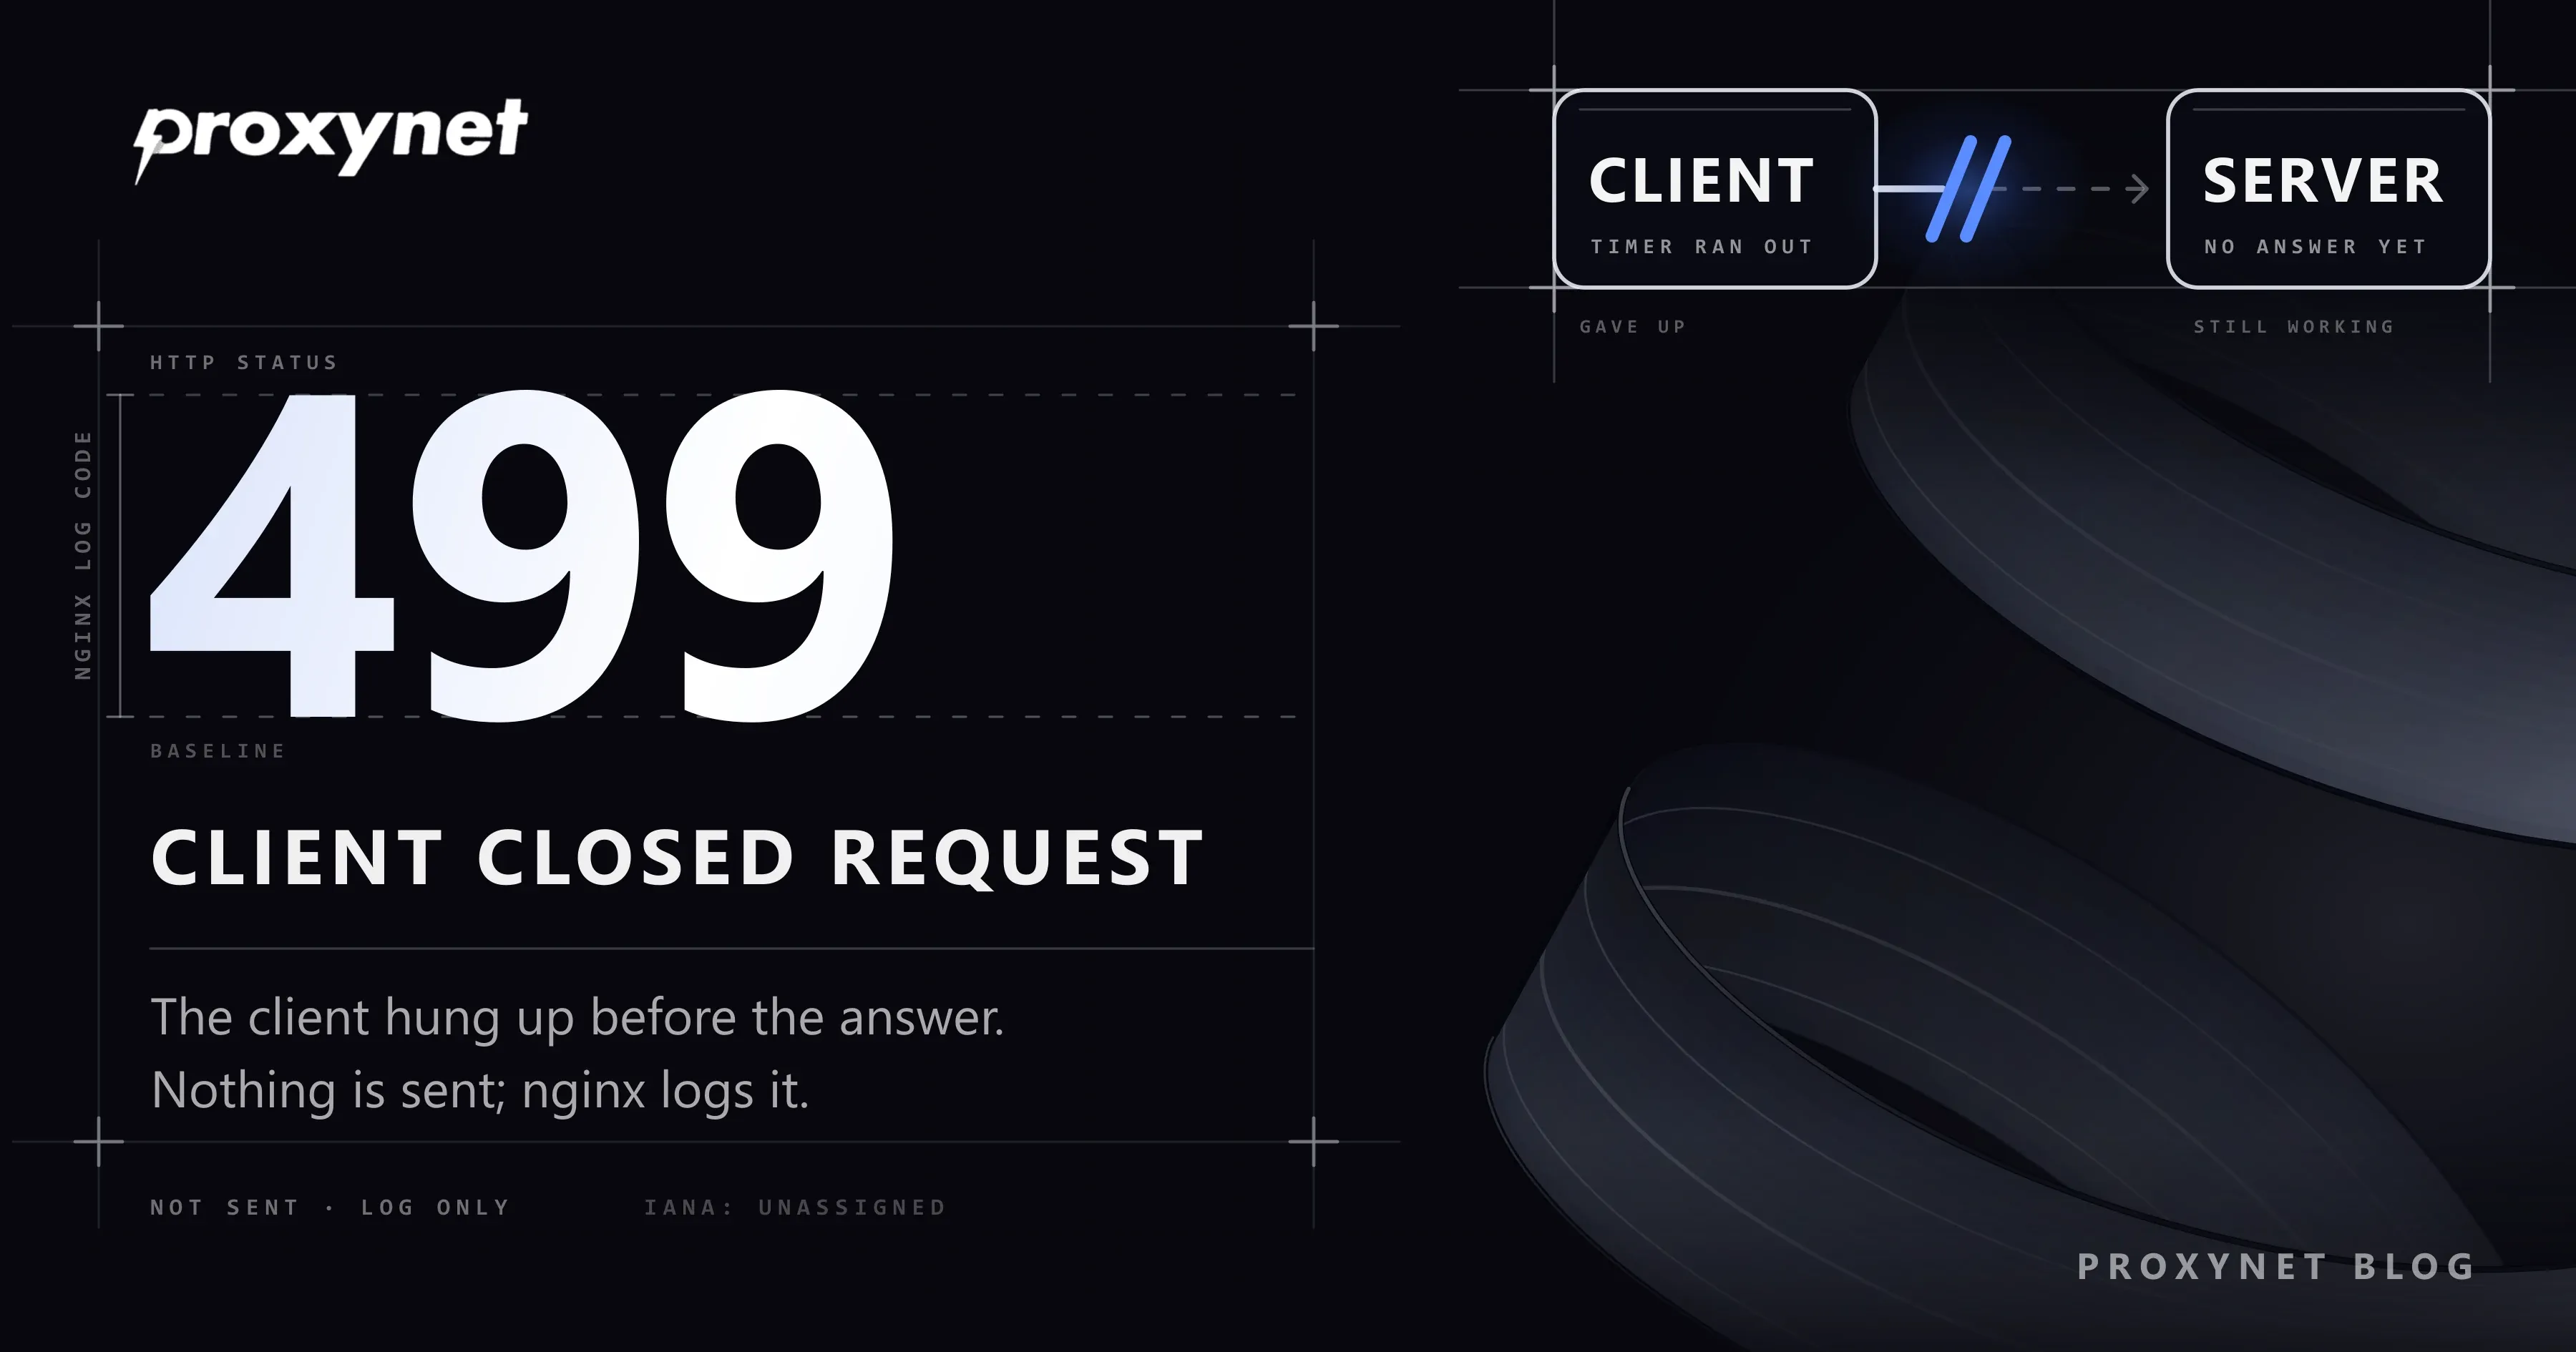
HTTP 499 means the client gave up on a request before the server answered. The client is whatever opened the connection: a browser, a mobile app, a script, or another server such as a load balancer. The code says nothing about whether the request was valid or whether the answer would have been correct.
The name comes from nginx's source code. In the file that defines its status codes, the nginx developers explain that HTTP has no code for a client that closes the connection while its request is being processed, so they introduced their own, NGX_HTTP_CLIENT_CLOSED_REQUEST, numbered 499. The comment limits it to clients that leave before nginx even tries to send the response header.
Is 499 an official HTTP status code?
No. The IANA registry of HTTP status codes, the official list behind the HTTP standard, shows the whole range from 452 to 499 as unassigned. 499 belongs to a small group nginx keeps for its own logs, next to 494 (request header too large), 495 and 496 (client certificate problems) and 497 (plain HTTP sent to an HTTPS port). Unlike a real 4xx code such as 404 or 429, it is a log entry, not a response: no client ever receives it.
Who sees a 499 error?
Only the operator of the server sees it, in the access log or in analytics built from logs. Each side keeps its own record of the same moment:
| Who | What they see | Where |
|---|---|---|
| Browser user | A spinner that stops, or nothing | The page itself |
| curl | curl: (28) Operation timed out | Terminal, exit code 28 |
| Python Requests | ReadTimeout exception | Script output |
| nginx operator | Status 499, often 0 bytes | Access log |
We reproduced this on our test machine with a tiny Node.js server on 127.0.0.1 that answers every request after five seconds. curl --max-time 2 gave up with "Operation timed out after 2007 milliseconds with 0 bytes received" and exit code 28, which libcurl defines as an operation timeout; at the same moment the server recorded that the client had closed the connection before the answer, the event nginx logs as 499. With --max-time 8 the same request returned 200 after 5.0 seconds.
How does a 499 happen, step by step?
- The client sends a request and starts its own timer: a browser waits as long as the user does, a script as long as its timeout allows.
- nginx accepts it and passes it on to the application behind it.
- The answer takes longer than the client will wait: a heavy database query, a cold cache, a slow third-party API.
- The client closes the connection. The user navigates away, the script's timeout fires, or a load balancer in front cuts the request.
- nginx notices the closed connection, by default also closes its connection to the application, and logs the request with status 499.
Whether the application stops at step 5 depends on the application. Many frameworks notice the closed connection only when they try to write the answer, so the expensive query may still run to the end and its result is thrown away.
What causes HTTP 499?
Almost every 499 is a timeout mismatch or a person who stopped waiting. Check these causes roughly in this order:
- A client timeout shorter than the server's response time. An app that waits 10 seconds for an endpoint that needs 12 produces a steady stream of 499s.
- People leaving the page: closing a tab, pressing Stop, clicking away before the page loads.
- A load balancer, CDN or proxy in front of nginx with a shorter timeout. nginx then logs the middle layer's address as the client.
- Mobile networks. A phone that switches from Wi-Fi to mobile data drops the connection mid-request.
- Health checks and monitors that wait two seconds on a page that takes three.
- Scripts and crawlers with aggressive timeouts, including your own jobs through a proxy.
- Cancellation by the app itself. A search box cancels the previous request when the user types the next letter.
How is 499 different from 408, 502 and 504?
The difference is who gave up and whether a response was sent. 499 is the only one in this group that nobody receives:
| Code | Who gave up | Sent to the client? | Typical fix |
|---|---|---|---|
499 | The client | No, log only | Faster upstream, longer client timeout |
408 | The server, waiting for the request | Yes | Client must send faster |
502 | The gateway got a bad answer | Yes | Fix the crashed application |
504 | The gateway waited too long | Yes | Faster upstream, longer gateway timeout |
A 499 and a 504 often share a root cause, a slow upstream: if the client's timer runs out first you see 499, if nginx's does the client gets a 504. A broken answer from the application is a 502, covered in 502 Bad Gateway Error: What It Means and How to Fix It.
How do you read 499 in nginx logs?
Add timing fields to the access log, then look at how long the client waited before each 499. nginx's default combined format records the status but not the time, so start with a custom format:
log_format timed '$remote_addr - [$time_local] "$request" $status $body_bytes_sent '
                 'rt=$request_time urt=$upstream_response_time us=$upstream_status '
                 '"$http_user_agent"';
access_log /var/log/nginx/access.log timed;
$request_time is the time from the first byte nginx read from the client to the moment it wrote the log line, in seconds with millisecond resolution. $upstream_response_time is the time spent receiving the answer from the application, and $upstream_status is the status the application returned. A 499 line in this format might read (example values):
203.0.113.7 - [19/Nov/2026:10:42:13 +0000] "GET /reports/monthly HTTP/1.1" 499 0 rt=30.001 urt=30.000 us=- "ExampleApp/2.1"Three readings answer most questions:
- Do the 499s bunch at one value? If
rtreads30.001,30.002and29.999across hundreds of lines, some client has a 30-second timeout. Scattered values point to people leaving the page. - Who is the client? The address and user agent tell a browser from a mobile app, your load balancer or a monitoring service.
- How long does the endpoint normally need? Check
urton the successful requests for the same URL. If they often take longer than the bunched 499 value, the endpoint is too slow for that client. On the 499 line,us=-means the application had not sent a status yet.
Behind a load balancer, $remote_addr is the balancer's address on every line; log the forwarded client address too, or every 499 looks like it came from one machine.
How do you fix HTTP 499 on the server side?
Fix the slow request first and the timeouts second; a longer timeout only moves the waiting somewhere else.
- Find who closed the connection with the log fields above. A bunched value from your load balancer is a configuration fix; scattered values from browsers are a speed problem.
- Make the slow endpoint faster: cache the result, add the missing index, paginate a huge response.
- Turn long jobs into background jobs. Answer at once with a job ID (status 202 Accepted exists for this) and let the client check back when the report is ready.
- Line up the timeouts from outside in. Each layer should wait a little longer than the one behind it: client, then CDN or load balancer, then nginx, then the application. nginx's
proxy_read_timeoutis the wait between two reads from the application, not a limit for the whole response, and it defaults to 60 seconds (nginx proxy module). - Use
proxy_ignore_client_abortonly with a reason. Off by default, it decides whether nginx closes its connection to the application when the client leaves. Turning it on lets work that must complete finish, such as filling a cache, but every abandoned request then costs full server time. - Keep 499 visible but separate in monitoring. A few 499s are normal on any busy site; a sudden rise on one URL is an early sign that it has become slow.
What does 499 mean on Cloudflare and load balancers?
On Cloudflare, 499 means the same thing: the client closed the connection before the request finished. Cloudflare's error 499 documentation states that no 499 response is sent to the client and that the code appears only in logs. It names short client deadlines, slow origins and drops in cache hit rate as causes, and suggests comparing the 499 rate with all requests to the same endpoint. Since 19 January 2026, Cloudflare also logs cancelled HTTP/3 requests as 499, so sites may see more of them for HTTP/3 traffic.
Other load balancers use their own numbers for the same event. AWS's Application Load Balancer logs HTTP 460 when the client closes the connection before the balancer's idle timeout has passed, and its troubleshooting guide gives the same advice: answer before the client's timeout, or raise the client's timeout to match.
When the client is you: 499 from your own script
If a site's operator says your requests show up as 499, your script hung up before their server answered. The fix belongs in your code.
HTTP libraries usually split the timeout in two: the connect timeout limits how long the script waits to open the connection, the read timeout how long it waits for data once the request is out. Python's Requests library sets neither unless you do, so a script can hang for minutes, while a very short read timeout leaves a 499 on every slow page.
The example below waits longer on each attempt instead of hanging up at the same point again. We ran it against the same local test server (Python 3.13, Requests 2.34):
import time

import requests

URL = "http://127.0.0.1:18499/report"  # our local test server; it answers after 5 seconds
PROXIES = None  # or {"http": "http://user:pass@pr.proxynet.io:8000", "https": "http://user:pass@pr.proxynet.io:8000"}
CONNECT = 5  # seconds to open the connection
READ_TIMEOUTS = (2, 4, 8)  # each retry waits longer instead of hanging up at the same point


def fetch(url):
    for attempt, read in enumerate(READ_TIMEOUTS, start=1):
        started = time.monotonic()
        try:
            r = requests.get(url, proxies=PROXIES, timeout=(CONNECT, read))
            print(f"attempt {attempt}: HTTP {r.status_code} after {time.monotonic() - started:.1f} s")
            return r
        except requests.exceptions.ReadTimeout:
            # We hang up here; a server running nginx logs this request as 499.
            print(f"attempt {attempt}: no answer within {read} s, closed the connection")
        except requests.exceptions.ConnectTimeout:
            print(f"attempt {attempt}: could not connect within {CONNECT} s")
        time.sleep(1)
    raise RuntimeError(f"{url}: no answer within {READ_TIMEOUTS[-1]} s, check the server side")


fetch(URL)
Output:
attempt 1: no answer within 2 s, closed the connection
attempt 2: no answer within 4 s, closed the connection
attempt 3: HTTP 200 after 5.0 s
The server recorded the first two attempts as closed by the client after 2.0 and 4.0 seconds and the third as a normal 200. Retry this way only requests that change nothing, such as GET: a POST that timed out may still have been processed. If a page is slow for everyone, lower your request rate. How a crawler should treat the other codes it meets is in HTTP Status Codes in Web Scraping: 403, 407, 429, 503.
Does a proxy cause 499 errors?
A proxy does not create 499s, but it adds time that your timeout has to cover: each request travels to the proxy and on to the target, and an exit far from the target lengthens every round trip. A read timeout tuned for direct requests can fall short, and the target then logs a 499 with the proxy's exit address as the client.
Measure before you change anything: curl -w with %{time_connect} and %{time_starttransfer} shows how long the connection and the first byte take with and without the proxy. Set the timeout from those numbers, with room for slow pages. For long jobs against a few known sites, a Datacenter Proxy gives you a fixed exit address in a data center near the target, so the added time stays small and steady.
For large crawls, our web crawler setup includes an adjustable wait between requests, which keeps your load on the target low enough that its pages do not slow down in the first place.
Where you meet HTTP 499
- An nginx access log with 499 lines bunched at one request time.
- A Cloudflare log export with 499s next to a slow origin.
- An API whose mobile clients produce 499s during commutes.
- A crawler or data job whose read timeout is shorter than the target's response time.
Common mistakes
- Treating 499 as a server error. Counting 499s with 5xx errors sends you looking for crashes that do not exist.
- Raising every timeout to several minutes. The 499s disappear, but slow requests now hold connections and workers for minutes, and the user still waits.
- Turning on
proxy_ignore_client_aborteverywhere. A burst of impatient clients becomes a burst of full-cost work. - Retrying a timed-out POST blindly. The first attempt may have succeeded, and the retry creates a duplicate order or record.
- Keeping the same short timeout through a proxy. The extra hop needs room; measure it first.
Decision guide
| Situation | What to do |
|---|---|
| 499s bunch at one request time | Find the client or balancer with that timeout and align it |
| 499s scattered on one slow page | Speed up that endpoint or make it a background job |
| 499s from your load balancer's IP | Raise its timeout above nginx's, log forwarded IPs |
| Your script causes 499s on a site | Longer read timeout, retry GET only, lower concurrency |
| Work must finish even if the client leaves | Background job, or proxy_ignore_client_abort on that path |
| Sudden 499 rise on Cloudflare | Compare with all requests, check origin time and cache |
Frequently asked questions
Is HTTP 499 a client error or a server error?
It is recorded as a client-side event: the client closed the connection before the answer. The cause can still be on the server, because a slow response is what made the client give up.
Can a user see a 499 error page?
No. Nothing is sent to the client, so a browser never shows "499". The user sees a page that stopped loading or the browser's own timeout message.
What does 499 mean in nginx?
It is nginx's own code for "client closed request": the client closed the connection before nginx sent the response header. nginx defines it because the HTTP standard has no code for this case.
What does HTTP 499 mean on Cloudflare?
The same: the client closed the connection before Cloudflare finished the request. It appears in logs and analytics only, most often because of client timeouts, slow origins or cache misses.
Does a 499 mean the server stopped processing the request?
Not necessarily. By default nginx closes its connection to the application, but the application may keep working until it tries to send the answer, so a timed-out POST may have been completed.
How do I fix a 499 timeout?
Find who closed the connection from the request time and client address in the log, speed up slow work or move it to a background job, then make each timeout longer than the one behind it.
Summary
HTTP 499 is nginx's log entry for a client that closed the connection before the server answered; it is not an official status code and never reaches the client. Bunched request times point to a timeout somewhere in the chain, scattered ones to slow pages and impatient users. Fix the slow endpoint, move long work out of the request and line up timeouts from the client inward. When your own script is the client, give it a read timeout that covers the target and any proxy hop, retry only safe requests, and compare our proxy types if you need a steadier exit.