

































One website takes ages to load while every other site opens at once, or your internet provider's support line asks you to "send us a tracert". Both lead to the same tool. Traceroute shows the routers your traffic passes on its way to a site, one line per router, with the time each one takes to answer, so you can see roughly where a connection slows down or stops.
Below: how traceroute works, a real run on Windows, the Mac and Linux command, reading the output, ping versus traceroute, finding where a problem sits and why a trace ignores your proxy, then a decision table and six common questions.
What is traceroute?
Traceroute is a command that shows the path your traffic takes to another computer on the internet. Between you and a website sits a chain of routers: your home router, several in your provider's network, often a few in networks that carry traffic between providers, and finally the site's own network. Each router that passes your packets on is one hop.
Windows calls the command tracert; Mac and Linux call it traceroute. Both do the same job with slightly different probe packets. The output is a numbered list with one line per hop: three time measurements and the router's address, sometimes with a name.
A trace shows how many hops lie between you and the site, where the delay grows and where the answers stop. It sees one direction only: replies can come back along a different route, which is one reason times sometimes look odd.
How does traceroute work?
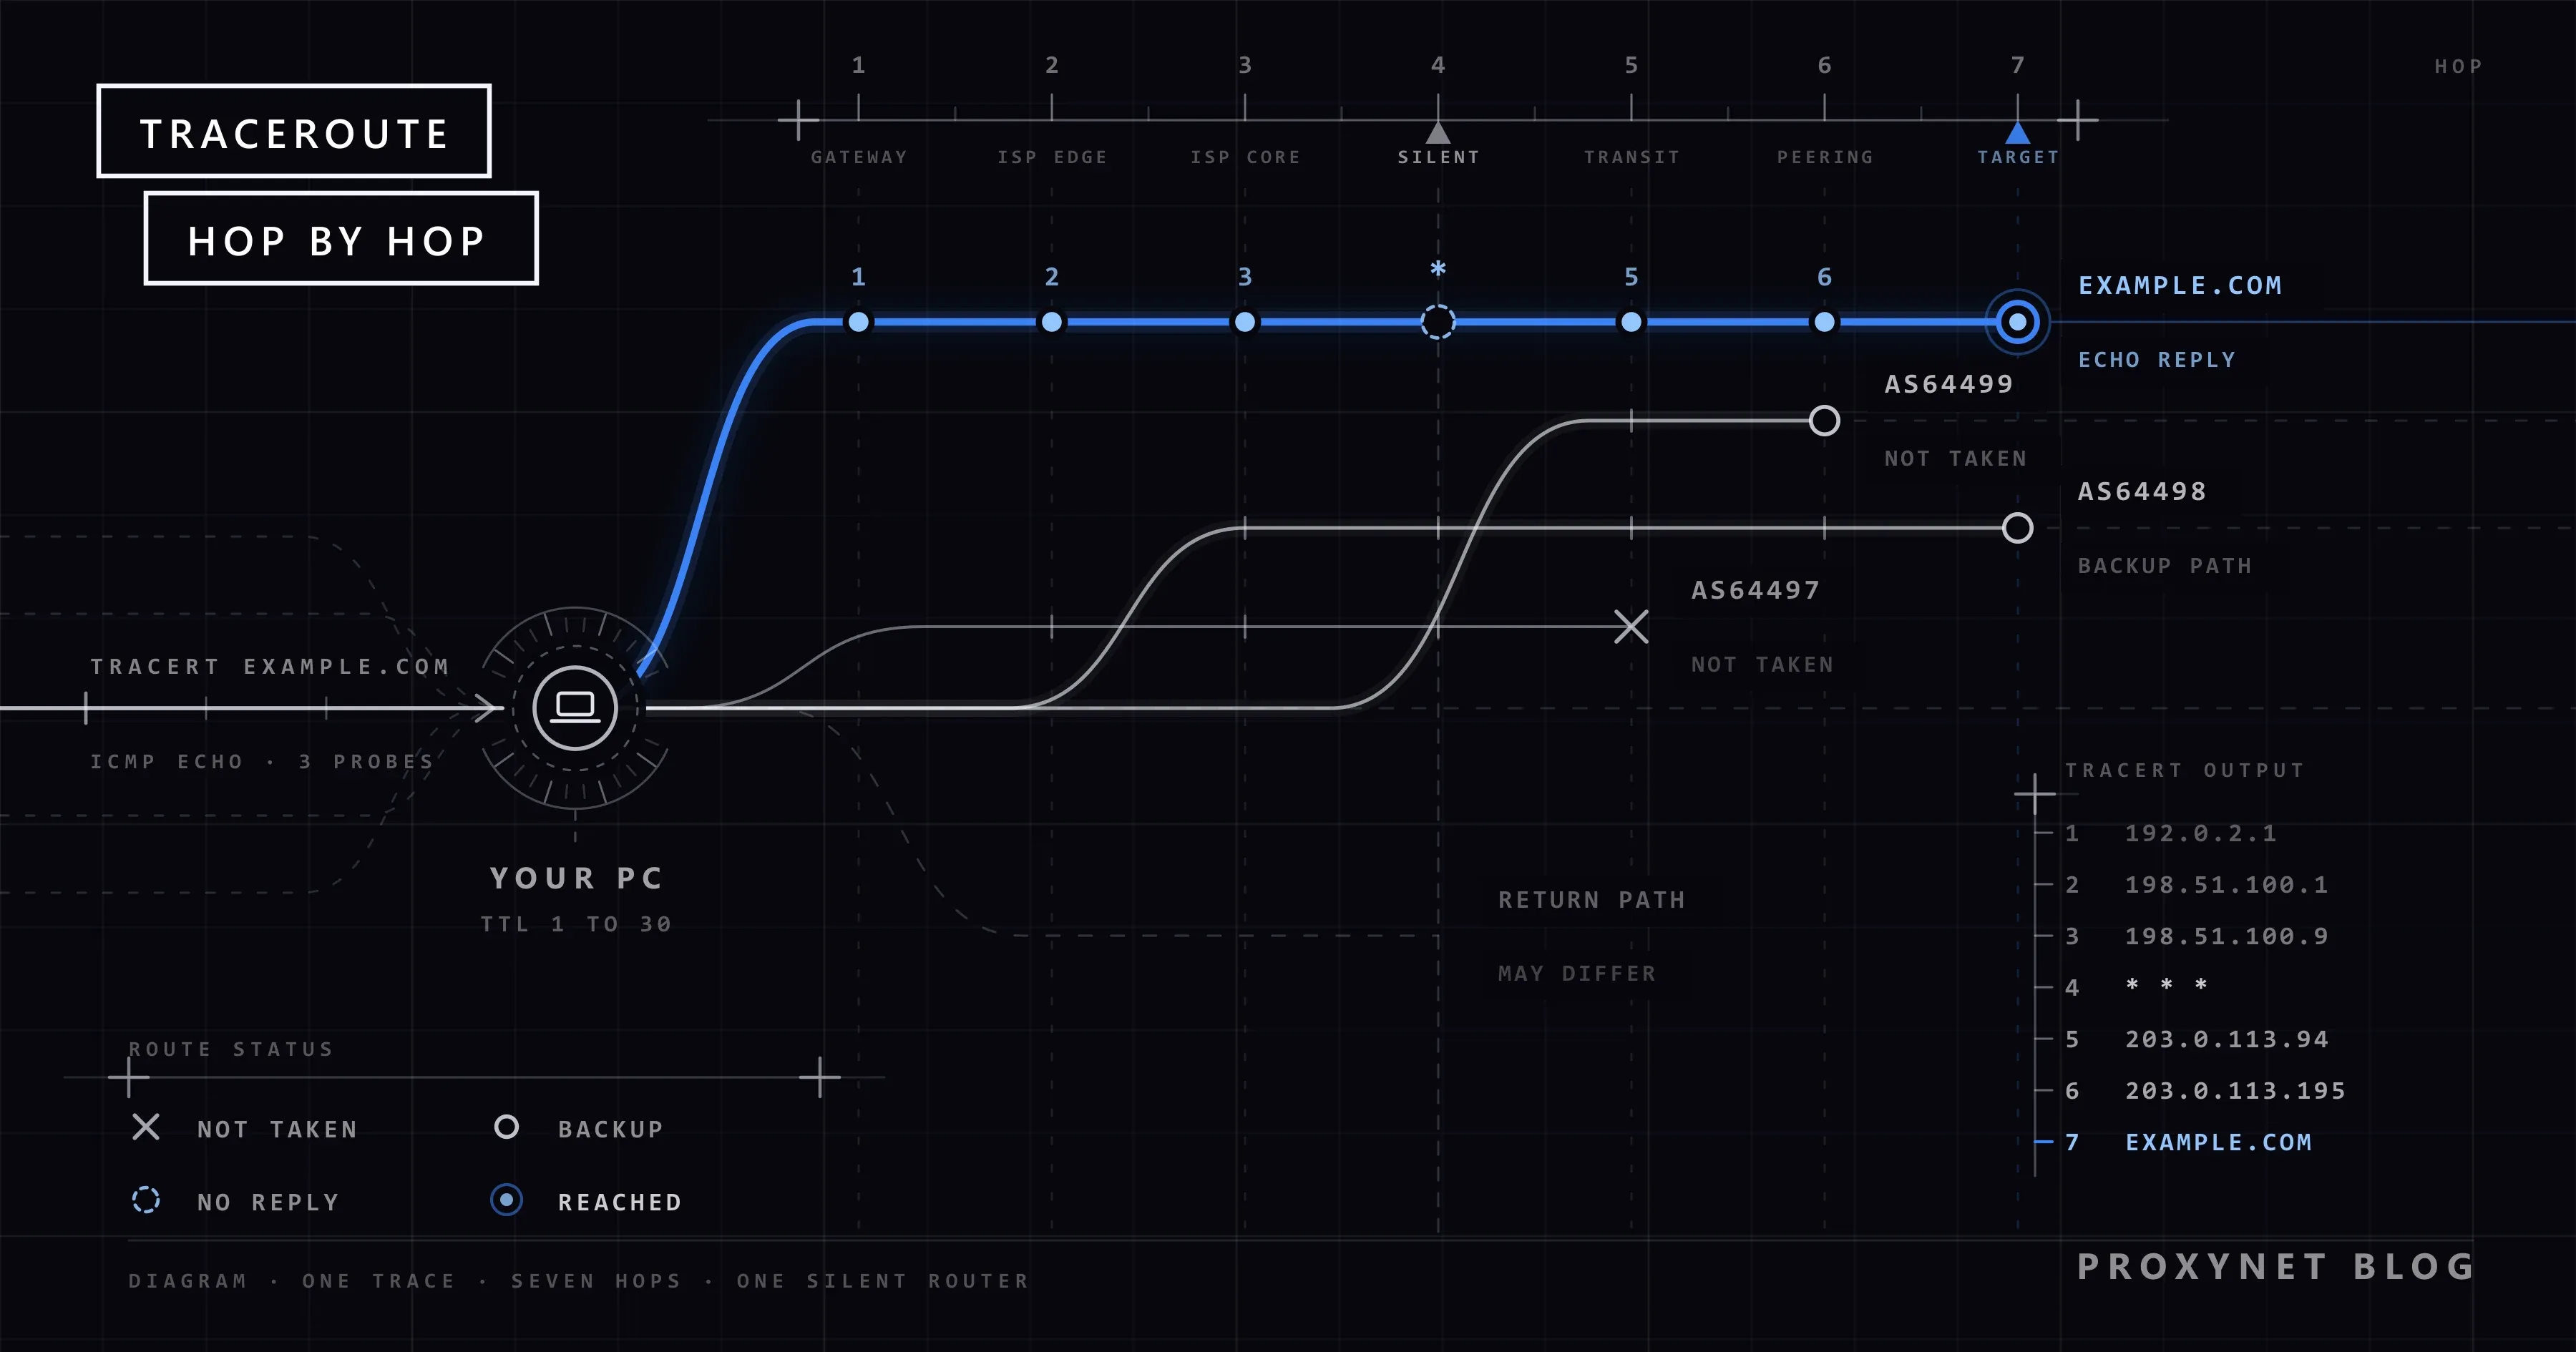
Every IP packet carries a time to live (TTL) field, a counter that stops a lost packet from circling the internet forever. Each router lowers it by at least one, and a router that finds it at zero discards the packet. RFC 792, the 1981 specification of ICMP (the Internet Control Message Protocol, the internet's error and status messages), defines the reply that router sends back: "time exceeded", type 11, code 0. Traceroute turns that safety rule into a map:
- TTL 1. Your computer sends a probe with a TTL of 1. Your home router lowers it to zero, discards it and returns "time exceeded". The reply carries the router's address, and its travel time is the first measurement.
- TTL 2. The next probe passes the first router and runs out at the second, which answers the same way.
- One hop further each round. Every round adds one to the TTL and reveals the next router. Windows sends three probes per hop, hence three times per line.
- The destination answers itself. The target replies directly: with an echo reply to the ICMP probes Windows sends, or with "port unreachable" to the UDP probes Linux traceroute sends by default. That reply is the last line.
- Silence becomes an asterisk. If no answer arrives within the wait time, four seconds per probe on Windows, the tool prints
*and moves on. Windows gives up after 30 hops.
Microsoft's tracert reference describes the same sequence, including routers that never send "time exceeded" and appear only as a row of asterisks. IPv6 works the same way; there the counter is called the hop limit.
How do you run tracert on Windows?
You run tracert in Command Prompt, and it needs no administrator rights.
- Type
cmdin the Search box on the taskbar and open Command Prompt. - Type
tracert, a space and the site's name or IP address, then press Enter. - Wait for the prompt to return. A trace usually takes seconds to a minute; each silent hop adds about 12 seconds (three probes, four seconds each).
tracert example.comThis is what our Windows 11 test machine printed on 12 November 2026:
Tracing route to example.com [172.66.147.243]
over a maximum of 30 hops:

  1    <1 ms    <1 ms    <1 ms  router.example [192.0.2.1]
  2     3 ms     2 ms     2 ms  198.51.100.1
  3     3 ms     2 ms     3 ms  198.51.100.9
 ...
 11    11 ms    11 ms    12 ms  203.0.113.94
 12    11 ms    12 ms    11 ms  203.0.113.195
 13    10 ms    10 ms    10 ms  172.66.147.243

Trace complete.
We shortened the output: hops 4 to 10, all inside our provider's network, are cut, and the name and addresses of hops 1 to 12 are replaced with documentation values, ranges reserved for examples. The header, the times and the last hop are as printed. Your hops and times will differ.
Four options cover most needs. Microsoft's documentation writes them with a slash (/d), tracert /? with a dash, and both work:
| Option | What it does |
|---|---|
-d | Skips name lookups, so results come faster |
-h 15 | Stops after 15 hops instead of 30 |
-w 1000 | Waits 1,000 ms per answer instead of 4,000 |
-4 or -6 | Traces over IPv4 or IPv6 only |
To send the result to your provider's support, save it with tracert example.com > tracert.txt. Nothing appears on screen while it runs; when the prompt returns, the file sits in the folder shown before the prompt, normally your user folder.
How do you run traceroute on a Mac or Linux?
On a Mac, open Terminal through Spotlight or the Applications > Utilities folder and type the command below. On Linux, use any terminal; if the command is not found, install the traceroute package with your distribution's package manager.
traceroute example.comThe output reads like tracert's. The Linux version sends UDP probes to unlikely high ports, starting at 33434, and recognises the destination by its "port unreachable" answer, as the traceroute manual page explains. -I switches to ICMP like Windows, -T to TCP and -n skips name lookups; when one method ends in asterisks, another sometimes gets through.
Two tools take a longer look. Windows pathping traces the route, then sends 100 pings to every hop and reports loss per router and per link; on our 13-hop path it announced "Computing statistics for 325 seconds". On Mac and Linux, mtr, where installed, combines traceroute and ping in one screen that keeps refreshing.
How do you read traceroute output?
Each line is one hop, read from left to right:
- Hop number. Counts the routers from your computer; the last line is the destination.
- Three times in ms. The round trip to that router and back, measured three times.
<1 msmeans under one millisecond, usual for your own router. - Name or address. The router's IP address, with a name in front when a reverse DNS lookup finds one.
Hop 1 is almost always your own router, the device your computer hands all outside traffic to, which Windows calls the default gateway. The next hops belong to your provider, then to the networks between your provider and the site.
The pattern matters more than single values. Times that rise step by step are normal. A jump that lasts to the last line comes from that link: on one trace to a distant server our times sat near 76 ms, rose to 130 ms at one hop and stayed there, which points to a long or busy link.
One slow hop followed by normal hops is usually harmless. Routers answer probes at low priority, apart from forwarding, so a busy one replies late while still passing traffic on; Microsoft's pathping documentation makes the same point about routers that drop packets addressed to them. In our trace to example.org, hop 12 answered in 55, 40 and 11 ms, while the destination behind it answered in 10 ms.
Asterisks follow the same logic. A single * is one lost reply; our trace to iana.org had a 3 ms 2 ms * line mid-path and went on normally. A full Request timed out. row with answers after it is a router that never sends "time exceeded". Timeouts that run to the hop limit are different:
Tracing route to man7.org [45.84.74.9]
over a maximum of 30 hops:
 ...
 13    53 ms    53 ms    53 ms  203.0.113.19
 14    54 ms    53 ms    53 ms  203.0.113.6
 15     *        *        *     Request timed out.
 16     *        *        *     Request timed out.
 17     *        *        *     Request timed out.
 ...
 30     *        *        *     Request timed out.

Trace complete.
This is tracert -d man7.org from the same machine, shortened and masked the same way. Nothing answered from hop 15 on, yet the site opened normally in a browser: web pages travel over TCP, which that network lets through, while it ignores the echo requests tracert sends. And Windows still printed "Trace complete." although the destination never replied.
Traceroute vs ping: what is the difference?
Ping asks whether the destination answers and how fast; traceroute asks where along the way the time goes. Ping sends echo requests straight to the target, while traceroute builds the list of routers one TTL at a time.
| Ping | Traceroute | |
|---|---|---|
| Question | Does the host answer, how fast? | Which routers lie on the way? |
| Probes | Echo requests to the target | Probes with TTL 1, 2, 3… |
| Output | One line per reply, loss at the end | One line per hop, three times each |
| Windows command | ping example.com | tracert example.com |
| Best for | A quick "is it up?" check | Finding where delay or loss starts |
Use them in that order: ping first, then a trace if the answer is slow or missing.
Is the problem in my network, my provider's or the site's?
Traceroute works best as a comparison: one trace to the failing site, one to a site that loads normally.
- Run both traces. Trace the slow or unreachable site, then a large site that works for you.
- Check hop 1. High times or no answer from your own router point to your home network: Wi-Fi, cable or the router. Restart it and try a cable first.
- Check the hops after your router. If both traces turn slow or stop at the same early hop, the trouble is in your provider's network. Save both traces and send them to support.
- Check the end of the failing trace. If it runs cleanly through your provider and only the last hops go silent or slow, the problem sits near the site, and waiting or contacting the site is all you can do.
- Look up who owns a hop. Every public address belongs to a network with its own number, an ASN, and a lookup names that network; What Is an ASN? shows how.
If a browser shows ERR_CONNECTION_TIMED_OUT for one site but the trace reaches the site's address, the route works and the web server is what fails to answer.
Does traceroute go through a proxy?
No. Traceroute works at the network level with packets whose TTL it sets itself, while an HTTP or SOCKS proxy relays application connections, such as a browser's, in new packets of its own. So a trace shows your own route even while your browser uses a proxy; even SOCKS5, which can carry UDP, forwards the data, not your packets with their TTL.
To see the path from another place you need a machine there: a rented server, or a looking glass, a page where a network operator lets visitors trace from its routers. Online traceroute sites also trace from their server, not your computer.
To check what a proxy changes, test what a website sees instead: the public IP address, its location and its network, as described in How to Test a Proxy.
A Residential Proxy gives your web requests an exit address on a home connection in the country and city you pick, which is how visitors there see a site.
For monitoring from fixed addresses that never change, a Datacenter Proxy is the steadier choice.
Where traceroute helps
- Reporting a fault. Providers ask for a trace because it shows the hop where your traffic stops.
- One slow site. Seeing whether the delay starts at your router, in your provider's network or near the site.
- A new connection. Checking the first hops after a move to a new provider or router.
- Your own server. Site owners tracing from their server towards a network whose users cannot connect.
Common mistakes
- Blaming one slow hop. If the hops after it are fast, that router just answers probes slowly.
- Reading a mid-path
Request timed outas a broken link. A silent router in a working path is normal. - Taking "Trace complete." as success. Windows prints it whether the target answered or not.
- Expecting the last hop to be the site's server. Many sites sit behind a content delivery network, so the trace ends at a nearby edge server; example.com even changed address between our runs.
- Tracing in a loop. One or two traces show the picture; repeated runs against other people's networks look like probing.
Decision guide
| What you see | What it usually means | What to do |
|---|---|---|
Hop 1 slow or * | Trouble between PC and router | Restart the router, try a cable |
| Every site slows at hop 2 or 3 | Your provider's network | Save the traces, send them to support |
| One slow hop, later hops normal | A router answering probes slowly | Nothing |
A * row mid-path, target answers | A silent router | Nothing |
| Timeouts to hop 30, site loads | The target ignores probes | Nothing |
| Timeouts to hop 30, site down | The path breaks near the site | Wait, or contact the site |
Frequently asked questions
Why does traceroute show * * * or "Request timed out"?
No reply came back in time for that hop. Usually the router does not send "time exceeded" messages, and the path through it still works; only timeouts that last to the end while the site also fails point to a real break.
What does a high ms value in traceroute mean?
That router answered slowly, which matters only if the hops after it are slow too. A jump that stays to the destination is delay the link really adds.
What is the difference between tracert and traceroute?
They are the same tool under two names: tracert on Windows, traceroute on Mac and Linux. Windows sends ICMP echo requests; Linux sends UDP probes by default and can switch to ICMP or TCP. The output reads the same way.
What port and protocol does traceroute use?
Windows tracert uses ICMP, which has no ports. Linux traceroute sends UDP to ports starting at 33434 by default, and its TCP mode connects to port 80 unless you set another with -p. All versions rely on the routers' ICMP "time exceeded" replies.
How many hops is normal?
There is no normal number; it depends on distance and on how many networks lie in between. Our trace to example.com took 13 hops. Windows stops at 30 by default, and -h 40 raises the limit.
Is it safe and legal to run traceroute?
For normal use, yes: tracing the route to a site you visit is ordinary troubleshooting, and Windows, Mac and Linux all include the command. It sends three small probes per hop, at most 90 by default, and changes nothing anywhere. Do not run it in loops against other people's networks, and follow the IT rules at work or school.
Summary
Traceroute lists the routers between you and a destination by sending probes with a rising TTL and collecting each router's "time exceeded" answer. Run tracert or traceroute, read the pattern rather than single values, treat silent hops in the middle as normal, and compare a failing site with a working one. A trace always shows your own route; when your web requests need to leave from another country, city or network, compare the options on our proxy products page.