

































A pricing dashboard shows that a competitor cut prices on 300 products overnight, and the sales director wants a response by Monday. On Friday an analyst opens the raw rows. A third of the "cuts" are euro prices in a column the report reads as pounds, because the collection job ran from a server in another country, and forty rows carry the title of a verification page instead of a product name. Every job reported success, yet the data could not support the decision it was collected for. That gap is what data quality is about.
This post covers what data quality means, the six dimensions used to describe it, how to turn them into metrics and automated checks, how quality differs from cleaning, governance and integrity, the ways web data goes wrong without an error, and who is responsible for it.
What is data quality?
Data quality is how well a dataset serves a specific purpose, so the same data can be good enough for one job and too poor for another. The UK government's Data Quality Framework calls it "fitness for purpose": is this data good enough for what I want to use it for?
Take a table of competitor prices collected once a day. For a monthly report on price levels it works, even if a few products are missing on a few days. For a repricing rule that reacts within the hour, the same table falls short: a day-old price is stale, and one wrong value moves your own price. Quality is never a property of the data alone; it is the data measured against a use.
What are the six dimensions of data quality?
The six dimensions most often used are accuracy, completeness, consistency, timeliness, validity and uniqueness. They were defined by DAMA UK, a data management association, and the UK government recommends them in a short explainer of the six dimensions:
- Accuracy: the data matches reality. A product stored at 19.99 really costs 19.99 on the shop's page.
- Completeness: every value the job needs is present. A price without a currency is incomplete.
- Consistency: values do not contradict each other, within a record or across datasets. "Out of stock" next to a stock count of 40 is inconsistent.
- Timeliness: the data is current when it is needed. Yesterday's price suits a weekly report and is late for a same-day alert.
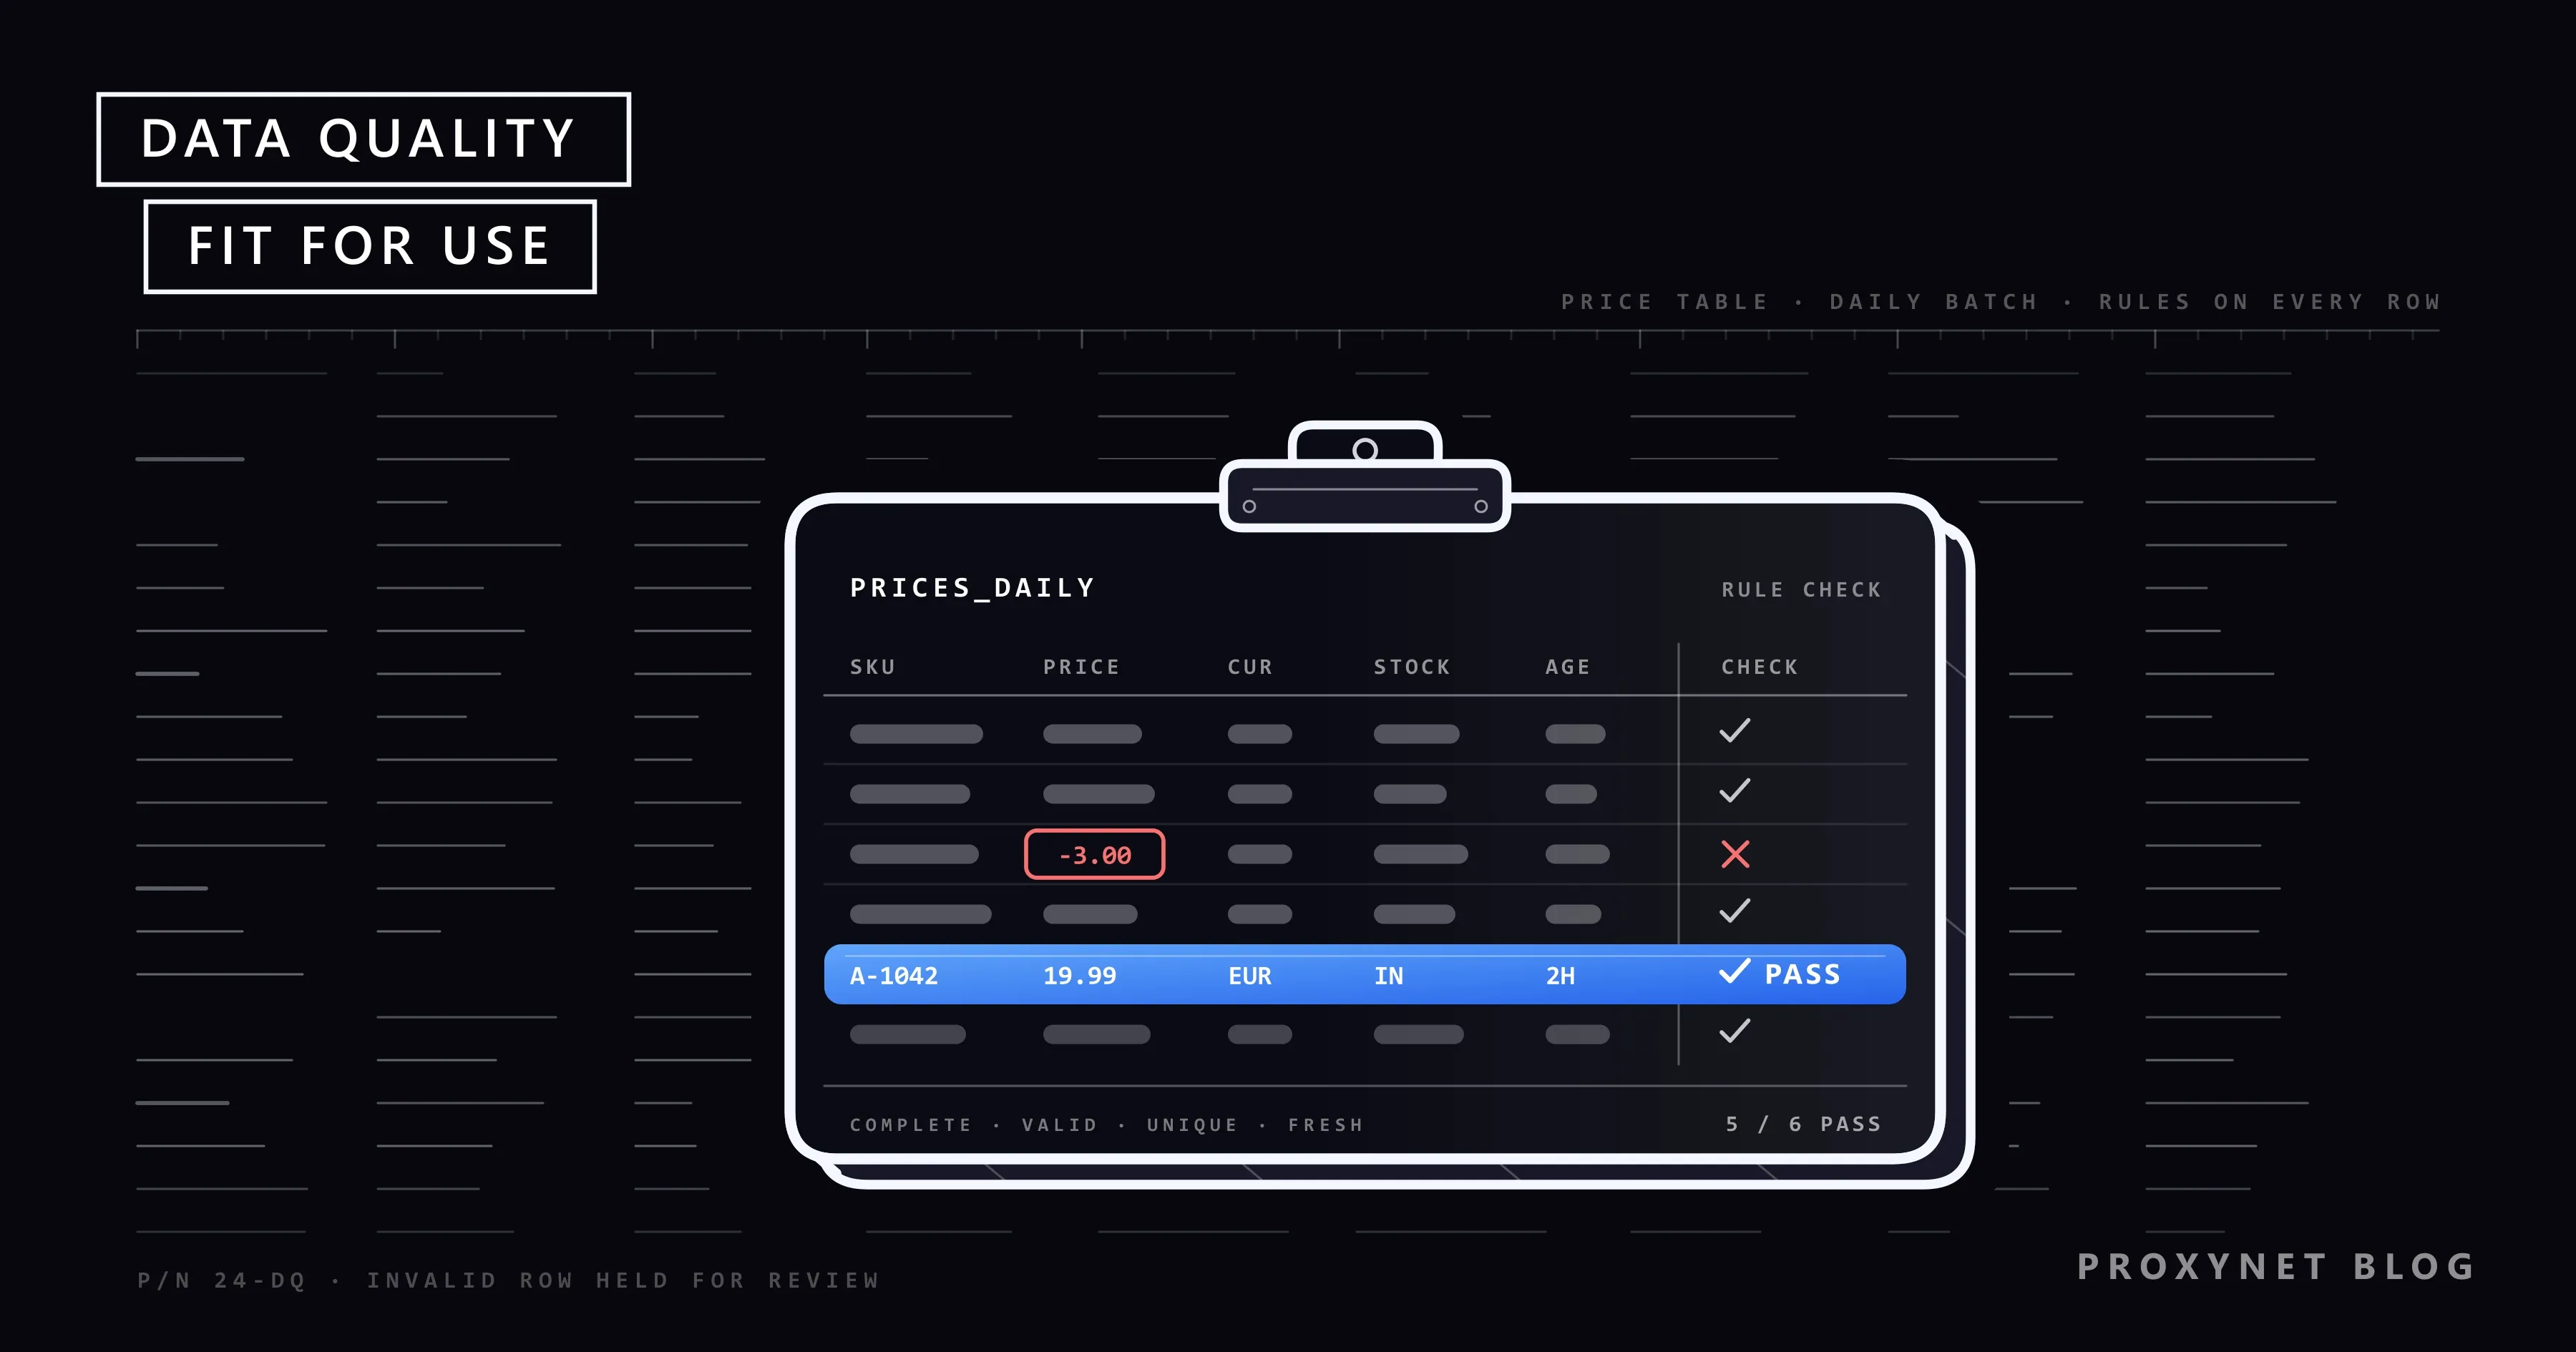
- Validity: values follow the expected format, type and range. A price of -3 or the currency code "EURO" fails.
- Uniqueness: each real-world thing appears once. A product collected from two addresses counts twice in every average.
The dimensions overlap, but none replaces another. A value can be valid and still wrong: "EUR" is a valid currency code, yet inaccurate if the shop charged in pounds. So you pick the dimensions your purpose depends on and check them together; the UK guidance treats the list as a starting point, not a fixed rule.
| Dimension | Question it answers | Example check | Typical metric |
|---|---|---|---|
| Accuracy | Does it match reality? | Compare a sample with the source | % correct in sample |
| Completeness | Is everything needed there? | Price and currency not empty | % of rows filled |
| Consistency | Do the values agree? | Out of stock means stock is 0 | % of rows that agree |
| Timeliness | Is it recent enough? | Collected in the last 24 hours | Hours since collection |
| Validity | Is the format right? | Price above 0, known currency | % of valid values |
| Uniqueness | Is each thing there once? | One row per product per day | Duplicate rate |
How do you measure data quality?
You measure data quality by turning each relevant dimension into a rule a computer can check, running the rules over the data and tracking the share of records that pass. Six steps cover most setups:
- Pick the critical fields. List the decisions the data feeds and the fields they depend on. For a price tracker: product ID, price, currency, stock status and collection time.
- Write the rules. State what "good" means in testable terms: "price is a number above zero", "collected within 24 hours".
- Profile the data. Look at what the data actually contains: empty values, distinct values, minimum and maximum, common formats. Profiling often reveals rules nobody wrote, such as a placeholder price of 0.01.
- Score each dimension. Run the rules and turn the results into ratios per field.
- Set thresholds. Agree on acceptable scores with the people who use the data, for example price completeness above 99%. Give each threshold an action: warn, hold the batch or block it.
- Monitor and alert. Run the same checks on every batch, store the scores over time and alert someone when a score crosses its threshold or jumps between two runs.
The metrics are simple ratios. In a fictional catalog of 10,000 product rows, 9,700 rows with a price give 97% completeness, and 150 rows that repeat a product already listed give a 1.5% duplicate rate. Validity is the share of values that pass the format and range rules, and freshness lag is the time since each record was collected. Accuracy is the share of correct values in a sample checked by hand against the source, the one dimension no rule can fully test.
Some teams combine everything into one data quality score, often the share of checks passed. It is handy on a dashboard but hides detail: 98% overall can mean the price field failed on every row of one market.
What do data quality checks look like in practice?
Data quality checks are small automated tests that run where data enters, changes or leaves a system, and each one passes, warns or stops the batch. The common kinds:
- Schema and type checks: the expected columns exist and hold the right type.
- Format and range checks: dates parse, currency codes come from a known list, prices stay within a plausible range.
- Referential checks: a value that points elsewhere finds its target, such as each price row's product ID in the product table.
- Cross-field checks: fields in one record agree, for example a sale price no higher than the regular price.
- Volume and freshness checks: the batch has the usual number of rows and arrived on time; 200 rows instead of 20,000 is a problem even if all 200 are perfect.
- Anomaly alerts: a statistic moves far from its recent history, such as a category's average price halving overnight.
Run the strict checks where data enters, so bad rows are quarantined (set aside for review rather than loaded or deleted), and the anomaly checks after each batch. Then fix causes at the source; the UK framework recommends root cause analysis over temporary fixes.
How is data quality different from data cleaning, governance and integrity?
Data quality measures whether data is fit for use; cleaning is one way to improve it, governance is the set of rules and roles around it, and integrity means data has not been changed or lost without authorization. The terms are often mixed up:
| Term | What it is | Question it answers |
|---|---|---|
| Data quality | How fit data is for a use | Can we rely on it for this decision? |
| Data cleaning | Repairing values already held | How do we fix what is wrong? |
| Data validation | Rule checks at entry or before use | Does this record follow the rules? |
| Data governance | Policies, roles and ownership | Who decides, and by which rules? |
| Data integrity | Protection from unauthorized change | Is the data still what was stored? |
| Data enrichment | Adding missing fields from other sources | What else do we need to know? |
Cleaning is the repair step: trimming spaces, turning price strings into numbers, merging duplicates. It raises quality but does not define it, and cleaning without checks can produce tidy data that is still wrong. A full tested script is in How to Clean Scraped Data with Pandas.
Integrity comes from security. NIST defines data integrity as the property that data has not been altered in an unauthorized manner since it was created, transmitted or stored. A database can keep perfect integrity while holding a price that was wrong from the start.
Enrichment raises completeness and can lower accuracy when a record is matched to the wrong source; What Is Data Enrichment? shows how to measure match and fill rates. Data observability, a term from monitoring tools, means watching freshness, volume and schema across many pipelines continuously.
How does web data go wrong without an error?
Web data goes wrong quietly because a scraper reads pages built for people, and when a page changes or is not the expected page, the job still returns something. Five failure modes cause most of the trouble:
- A layout change empties a field. The site rebuilds part of its page, the extractor finds nothing, and the price column fills with blanks while the job reports success. Track completeness per field per run: a drop from 99% to 0% is a broken extractor, not a market event.
- A block or verification page is stored as data. The site returns an "access denied" or verification page, sometimes with a normal status code, and the parser takes its title for a product name. Require a marker only the real page has, such as the product ID, and treat anything else as a failed fetch. Retry later at a slower rate; if the site keeps refusing, look for an official feed or API.
- The price comes from the wrong country. Many shops show prices, currency and stock for the visitor's location, so a job running from one country collects that country's version for every market. Store the currency code with every price and check it against the market the row describes; Why Do Prices Differ by Country? explains why prices differ.
- A cached copy hides a change. A cache, yours or one between you and the site, can keep serving yesterday's price. Store each page's fetch time and flag prices that stay unchanged far longer than usual.
- The same product appears under two URLs. Category paths and tracking parameters create several addresses for one page. Deduplicate on a stable key such as the product ID or the GTIN (the number under the barcode), and read the page's
rel="canonical"link, which RFC 6596 defines as a site's preferred address among duplicates.
Two of these failures depend on where the request comes from. A Residential Proxy with country and city targeting lets a price or stock check run as a local visitor in the market you measure. A sticky session keeps the same IP address through a multi-page check (1 to 60 minutes on our residential and mobile proxies), so the product page and the cart see the same version of the shop. A proxy does not make data correct: every record still goes through the checks, and the site's terms and request limits still apply.
Teams that would rather not run collection themselves can use managed page extraction through our Web Scraping API, available through our sales team.
Who is responsible for data quality?
Responsibility is shared, but every dataset needs a named owner who decides what "good enough" means and a steward who keeps it there:
- Data owner: a business lead, such as the head of pricing, who is accountable for the dataset, sets its thresholds and decides what happens when they are missed.
- Data steward: looks after the dataset day to day, maintains the rules, reviews quarantined records and traces issues to their cause.
- Data producers: the teams and systems that create or collect the data. Most problems are cheapest to fix here.
- Data consumers: analysts, data scientists and applications that use the data. They often notice problems first and need an easy way to report them.
A data quality analyst or engineer can build the checks and dashboards, but cannot replace an owner: without someone who can stop a report that misses its thresholds, they stay suggestions.
What does poor data quality cost?
Poor data quality costs money through wrong decisions and repeated work, and it creates legal risk where personal data or AI systems are involved. The figure worth knowing is your own: hours spent correcting reports, campaigns sent to wrong addresses, prices set on bad inputs. A model trained on duplicated or mislabeled records learns the errors.
For personal data, accuracy is a legal duty. The GDPR requires personal data to be accurate and, where necessary, kept up to date, with inaccurate data erased or rectified without delay (Article 5(1)(d)); Türkiye's KVKK (Law No. 6698) states the same principle in Article 4. The EU AI Act asks providers of high-risk AI systems to use training, validation and testing data that is relevant, sufficiently representative and, as far as possible, free of errors and complete for its intended purpose (Article 10).
Where does data quality matter most?
- Pricing and e-commerce: competitor prices, stock and promotions that feed repricing.
- Market research: survey answers, panel data and public web data behind market sizing.
- Machine learning: training and test data, where duplicates and wrong labels go straight into the model.
- Finance and reporting: figures that end up in management reports and filings.
- CRM and marketing: customer and account records used for segments and outreach.
- Operations: addresses, product dimensions and stock levels that drive deliveries.
Common mistakes
- Checking only the format. Valid data can still be wrong; compare a sample with the source.
- Reporting one overall score. A 98% average can hide a field that fails completely in one market.
- Thresholds without actions. A score that crosses its limit and changes nothing is decoration.
- Patching downstream. Fixing the report instead of the collection job means the same fix next week.
- Treating a successful run as good data. Returning rows is not the same as returning the right rows.
- No collection time per record. Without it, timeliness cannot be measured.
- Deleting bad rows silently. Quarantine and count them, or you cannot tell whether quality is improving.
Decision guide
| Need | Recommendation |
|---|---|
| Starting from nothing | Pick 5-10 critical fields; check completeness, validity and uniqueness first |
| A report nobody trusts | Profile the data; compare a sample with the source |
| Scraped data that breaks silently | Per-field completeness and row-count checks on every run |
| Prices or stock in several markets | Collect from each market; store currency and location per row |
| Duplicates inflating averages | Deduplicate on a stable product key, not on the URL |
| Personal data in the dataset | An accuracy and correction process under GDPR or local law |
| Training data for a model | Deduplicate, check labels on a sample, record sources |
| Many datasets, many teams | Name an owner and a steward per dataset; publish thresholds |
Frequently asked questions
What are the 6 dimensions of data quality?
The six dimensions are accuracy, completeness, consistency, timeliness, validity and uniqueness, as defined by DAMA UK. They ask whether data matches reality, is complete, agrees with itself, is current, follows the expected format and range, and lists each thing only once.
What is the difference between data quality and data integrity?
Data quality asks whether data is fit for a use: correct, complete, current and consistent. Data integrity asks whether data has stayed as it was stored, without unauthorized or accidental change or loss. A record can keep perfect integrity and still be wrong if it was wrong when first saved.
How do you measure data quality?
Choose the fields that matter, write a testable rule for each relevant dimension and compute the share of records that pass: percentage complete, percentage valid, duplicate rate, freshness lag and accuracy in a hand-checked sample. Set a threshold for each metric and track the scores on every new batch.
Who is responsible for data quality?
A data owner, usually a business lead, is accountable for a dataset and sets its thresholds, while a data steward maintains the rules and traces issues to their cause. The teams that produce the data fix problems at the source, and the people who use it report what looks wrong.
What is the difference between data quality and data cleaning?
Data quality is the measure; data cleaning is one way to improve it. Quality checks show which values are missing, invalid, duplicated or out of date, and cleaning repairs them. Cleaning without checks can produce tidy data that is still wrong.
How often should data quality be checked?
Check data quality automatically every time new data arrives, with the same rules each time. Review the rules and thresholds when the use changes or a new source is added, and re-check a hand sample for accuracy on a fixed schedule, such as once a month.
Summary
Data quality is fitness for a purpose, not a property data has on its own. Describe it with the six dimensions, turn the ones your use depends on into rules, score every batch and act when a score crosses its threshold. For web data, also check for the failures that raise no error, name an owner for every dataset and collect each market's data from that market; our price monitoring page matches each kind of price check to the proxy type it needs.