

































You download air-quality-2025.zip from a city's open data portal. Inside are three files: a CSV with one row per monitoring station per hour, a short PDF called "data dictionary" and a text file with a license. The CSV holds the numbers, but on its own it cannot tell you whether pm25 is an hourly or a daily average, whether the times are local or UTC, or whether you may publish a chart made from it. The three files together are the dataset; the CSV alone is just data.
This post covers what a dataset is, its rows, columns and types, how one is built and split for machine learning, famous examples, sources, file formats, licenses, documentation and personal data.
What is a dataset?
A dataset is a set of data about one subject, recorded at one level of detail and kept together so it can be analyzed as a whole. A shop's order history, a weather station's hourly readings and 10,000 labeled photos of road signs are all datasets, because every record in each describes the same kind of thing in the same way.
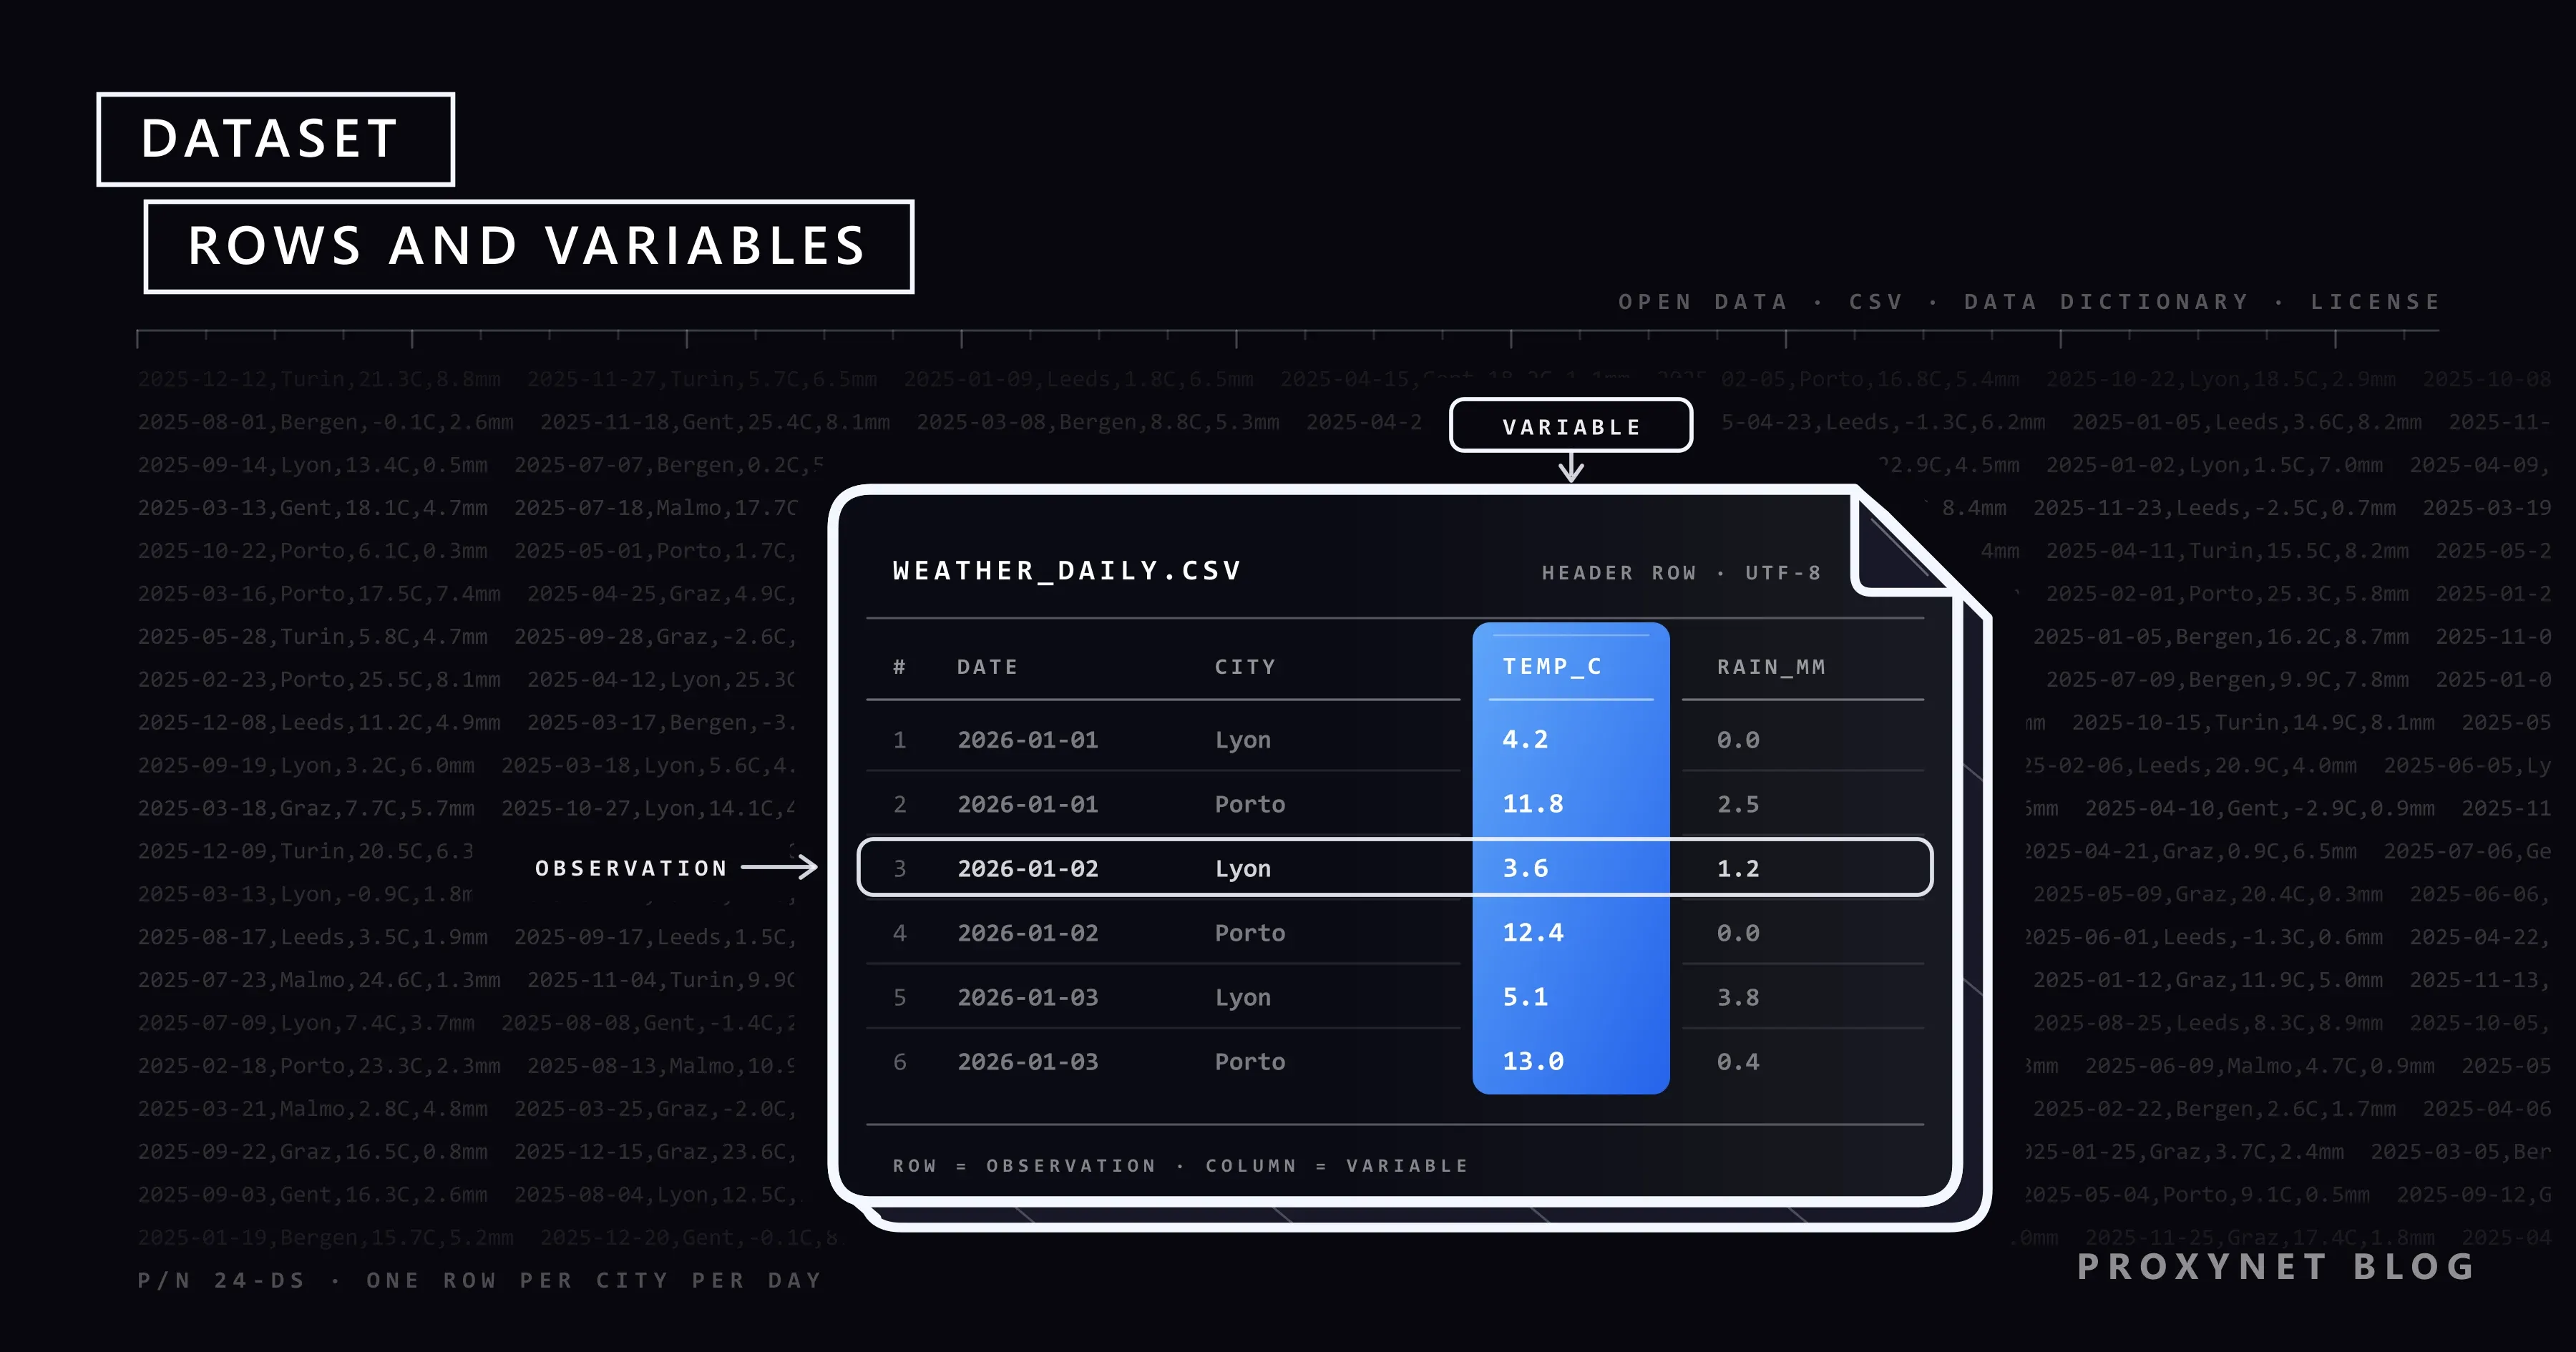
Most datasets you meet at work are tables. Here are the first rows of a small weather dataset in CSV form, where commas separate the values:
date,city,temp_c,rain_mm
2026-01-01,Lyon,4.2,0.0
2026-01-01,Porto,11.8,2.5
2026-01-02,Lyon,3.6,1.2
Each line after the header is one observation: one city on one day. Each column is one variable, recorded for every observation, and where a row and a column meet you find a value, such as 4.2 degrees. The thing a row describes is called the unit of observation; deciding it first (one row per city per day, not one per sensor reading) shapes everything else.
What are rows, columns and values in a dataset?
Rows are observations, columns are variables and each cell holds exactly one value. This arrangement, often called "tidy data", makes a dataset easy to filter, sum and join with another table, because almost every analysis tool expects one observation per row. A spreadsheet with merged cells and subtotals in the middle looks like a table but breaks the rule.
The kind of variable decides what you can calculate with it:
- Numeric: measurements (4.2 degrees) or counts (3 orders). Averages make sense.
- Categorical: labels from a fixed set, such as city. You count them; an "average city" means nothing.
- Date and time: comparable only when the format and time zone are known.
- Text: free text such as reviews, which needs processing before analysis.
- Identifier: an order number or product ID that links a row to other tables. It looks numeric but is never averaged.
A data dictionary lists every variable with its type, unit and allowed values. Without one, a column named temp could be Celsius or Fahrenheit, and a blank cell could mean zero, unknown or not applicable.
What does a dataset mean in statistics?
In statistics and school mathematics, a dataset is simply the list of values you analyze, often a single variable. The test scores 4, 7, 7, 9 and 13 form a dataset of five values: its range is 13 − 4 = 9, its median (the middle value once sorted) is 7, its mode (the most frequent value) is 7 and its mean is 40 ÷ 5 = 8.
A table with 12 columns is twelve such lists recorded side by side for the same observations, which lets you compare them, for example whether rainy days are colder.
What types of datasets are there?
Datasets are grouped by how strictly the data is structured and by what one record looks like. Structured data fits fixed columns, like a spreadsheet. Semi-structured data carries its own labels without a fixed table, like JSON from an API or log lines with key=value pairs. Unstructured data, such as free text, images and audio, has no predefined fields and usually needs labels or extracted features before analysis.
By the shape of a record, these are the types you meet most often:
| Type | One record is | Example | Typical format |
|---|---|---|---|
| Tabular | One observation, fixed fields | Orders, survey answers | CSV, Excel, Parquet |
| Time series | One value at one time | Hourly temperature | CSV, Parquet |
| Panel | One unit at one time | Daily prices of 500 products | CSV, Parquet |
| Text | One document | Reviews, news articles | JSON Lines, TXT |
| Image or audio | One file plus its label | Photos tagged "cat" | Folders + label file |
| Graph | One node or one link | Links between web pages | Edge lists, JSON |
A time series follows one thing over time, a cross-sectional dataset is a snapshot of many things at one moment, and panel data combines the two. In a time series each value depends on the ones before it, so its rows cannot be shuffled like survey answers.
How is a dataset built?
A dataset is built by deciding what one row means, collecting every row in the same way and writing down how it was done:
- Define the question. "How do our prices compare with three competitors each week?" sets the scope.
- Choose the unit of observation. Here: one row per product, per competitor, per day.
- Choose the variables. Product ID, competitor, price, currency, stock and collection time, each with a type and unit.
- Collect. From your own systems, an API, an official download or public web pages, with the same method for every row.
- Check and clean. Remove duplicates, fix types and flag missing values; What Is Data Quality? turns these checks into rules that run on every batch.
- Document. Write the data dictionary, source, collection dates and known gaps.
- Version and store. Give each release a date or number, so a chart made in March can be reproduced in June.
How are datasets used in machine learning?
In machine learning, a dataset is the set of examples a model learns from: each row holds features (the inputs) and, in supervised learning, a label (the answer the model should learn to predict). A spam filter, for example, learns from thousands of emails that people have labeled as spam or not spam.
Before training, the dataset is split into three parts that never overlap:
- Training set: the examples the model learns from, usually the largest part.
- Validation set: used during development to compare settings and decide when to stop training.
- Test set: kept aside and used once at the end, to estimate how the model does on data it has never seen.
If near-identical rows, such as two photos of the same object, land in both the training and the test set, the score looks better than it is; this is called data leakage. Time series are split by date, training on the past and testing on a later period, so the model cannot peek at the future.
What are some famous dataset examples?
Three public datasets show how much the word covers:
- Iris: 150 flowers from three species, with four measurements each, published by the statistician R. A. Fisher in 1936. The UCI Machine Learning Repository distributes it under a CC BY 4.0 license.
- MNIST: 70,000 grayscale images of handwritten digits, 28 × 28 pixels each, split into 60,000 training and 10,000 test images, each labeled 0 to 9. It is a standard first exercise in image classification.
- Common Crawl: petabytes of web pages collected regularly since 2008 and made freely available. Many text datasets for training language models are filtered from it; What Is Common Crawl? explains what a crawl contains.
Where do datasets come from?
Datasets come from a handful of places, and the source decides how far you can trust and reuse them:
- Official statistics: national statistics offices and international bodies publish population, price and trade data with documented methods.
- Open data portals: governments and cities publish budgets, timetables and air quality readings, usually under an open license.
- Research repositories: universities and journals host the data behind published papers.
- APIs: services expose data through documented endpoints with their own limits and terms.
- Your own systems: orders, server logs and CRM records; often the most valuable source and the most likely to hold personal data.
- Public web pages: prices, listings, job ads and reviews, collected within each site's terms and request limits.
To find an existing dataset, start with the organization that would collect it: unemployment data starts at the statistics office, bus delays at the city's open data portal.
What file formats do datasets use?
Most tabular datasets are shared as CSV, nested records as JSON or JSON Lines, and large analytical tables as Parquet. CSV is plain text with one row per line and commas between values; RFC 4180 documents its common form, including double quotes around any value that contains a comma, a quote or a line break.
On our test machine (Node.js 24), we saved the same table of 1,000 rows and 4 columns in both formats: the CSV file was 25,492 bytes and the JSON array 68,468 bytes, about 2.7 times larger, because JSON repeats every column name in every record. Splitting the line 2026-01-01,"Washington, D.C.",4.2,0.0 on commas gave five fields instead of four, while a quote-aware parser returned the correct four, so always read CSV with a real CSV parser.
Parquet is an open-source, column-oriented format that stores and compresses each column's values together, so a query that needs 2 of 50 columns reads only those 2. JSON Lines puts one record on each line, which suits growing logs and text.
What license does a dataset come with?
A dataset's license states what you may do with it; without one you have no clear permission to reuse it, because copyright or database rights can still apply. The common open licenses are:
- CC BY 4.0: share and adapt for any purpose, including commercially, if you credit the creator, link to the license and say whether you made changes. The Creative Commons summary lists the exact conditions.
- ODbL 1.0 (Open Database License): written for databases. Credit the source, offer any adapted database you use publicly under the same license, and if you add technical restrictions, also distribute a version without them.
- CC0: the publisher waives its rights as far as the law allows, so no conditions apply.
- Terms of use: data from an API or website falls under that service's terms, which can be stricter than any open license.
A license covers the publisher's rights, not the rights of the people in the data. A CC BY dataset of names and email addresses is still personal data.
How should a dataset be documented?
A dataset should come with enough documentation that a stranger can use it correctly without asking its author. The paper Datasheets for Datasets (Gebru and others, first published in 2018) proposes that every dataset ship with a datasheet covering its motivation, composition, collection process and recommended uses, the way electronic components ship with datasheets.
Even a short README goes a long way: what one row is, the source and method, the period covered, units and time zone, known gaps, the license, the version and a contact.
What if a dataset contains personal data?
If any row relates to a person who can be identified, the dataset contains personal data and data protection law applies. The GDPR defines personal data in Article 4(1) as any information relating to an identified or identifiable natural person, directly or through details such as a name, an ID number, location data or an online identifier. Türkiye's KVKK (Law No. 6698) uses the same idea in Article 3.
Removing names is not enough: pseudonymized data, where names are replaced by codes and the key is kept elsewhere, is still personal data under the GDPR. Collect only the columns you need, mask direct identifiers, limit access and set a deletion date; How to Handle Personal Data in Scraped Datasets walks through these steps for web data.
How do you build a dataset from public web pages?
When no download or API exists, the hard part of using public web pages is collecting every row under the same conditions. Many sites show different prices, currencies, stock and language by the visitor's country, so a dataset collected from one location quietly describes only that location. A Residential Proxy with country and city targeting lets each market's rows be collected as a local visitor would see them, and a sticky session keeps one IP address for 1 to 60 minutes across a multi-page check.
Record the collection country and time in every row, respect each site's robots.txt, terms and request limits, and use an official API or download wherever one exists. Teams that would rather not run collection themselves can use managed page extraction through our Web Scraping API, available through our sales team.
Where are datasets used?
- Business analytics: sales and cost tables behind dashboards and reports.
- Machine learning and AI: training and test data, from spam filters to language models.
- Research: surveys, experiments and official statistics behind published studies.
- Pricing and e-commerce: competitor prices and stock tracked over time.
- Public sector and journalism: budgets and transport data that make claims checkable.
Common mistakes
- No unit of observation. Mixing one row per order with one row per customer makes every total wrong.
- Two values in one cell. "12 kg / 26 lb" cannot be summed or filtered.
- Missing units and time zones. A price without a currency is a guess.
- Splitting CSV on commas. Quoted values with commas shift the columns.
- Ignoring the license. "Found online" is not a license.
- Leaking test data into training. Duplicates across the split inflate every score.
- No version or collection date. Results nobody can reproduce cannot be trusted.
Decision guide
| Need | Recommendation |
|---|---|
| A small table people edit by hand | Excel or CSV with a data dictionary |
| Sharing a table with other tools | CSV with a header row, UTF-8, quoted values |
| Large tables for analysis | Parquet, partitioned by date |
| Nested records from an API | JSON Lines |
| Training a model | Separate training, validation and test sets |
| Time-ordered data | Split by date, never at random |
| Reusing someone else's data | Check the license and its conditions first |
| Data about people | Collect only what you need; mask identifiers |
| Prices or listings in several countries | Collect each market from that market |
Frequently asked questions
What is a dataset in simple terms?
A dataset is a collection of related data kept together for one purpose, most often a table. Each row describes one thing, such as a sale or a day, and each column records one property of it, such as the price or the temperature.
What is the difference between a dataset and a database?
A dataset is the data itself, collected for a purpose; a database is the software that stores data and answers queries. One database can hold many datasets, and one dataset can live in a database, a CSV file or a spreadsheet.
What is an example of a dataset?
A shop's list of orders is a dataset: one row per order, with columns for date, product, quantity and price. Well-known public examples are Iris, MNIST and Common Crawl.
What is a dataset in machine learning?
It is the set of examples a model learns from and is tested on. Each example holds features (the inputs) and usually a label (the correct answer), split into training, validation and test sets.
Where can I find free datasets?
Start with the organization that would collect the data: national statistics offices, government and city open data portals, research repositories such as the UCI Machine Learning Repository and international bodies. Check each dataset's license before you reuse it, even when the download is free.
How do you create your own dataset?
Decide the question, define what one row represents and choose the variables with their types and units. Collect every row the same way, check and clean the result, then write a short README with the source, dates and license and give each release a version.
Summary
A dataset is related data organized for one purpose, usually a table of observations and variables, plus the documentation and license that make it usable. Decide what one row means before you collect anything, keep one value per cell and record units, time zones and collection dates. Check the license before reuse, treat personal data as a legal duty, and when web pages change by country, collect each market from that market.