

































A small online shop sells on its own website and on two marketplaces. On Monday morning the owner asks one question: how much did we sell yesterday? The answer sits in three exports with three column layouts, two currencies and timestamps in two time zones, and one order appears twice because it was refunded and placed again. Turning those files into one honest number is data aggregation.
This post covers the two meanings of the term, the steps of an aggregation job, the functions that summarize, aggregation by time and place, examples from price comparison to open banking, where aggregated data stops being anonymous, and the mistakes that distort a total.
What is data aggregation?
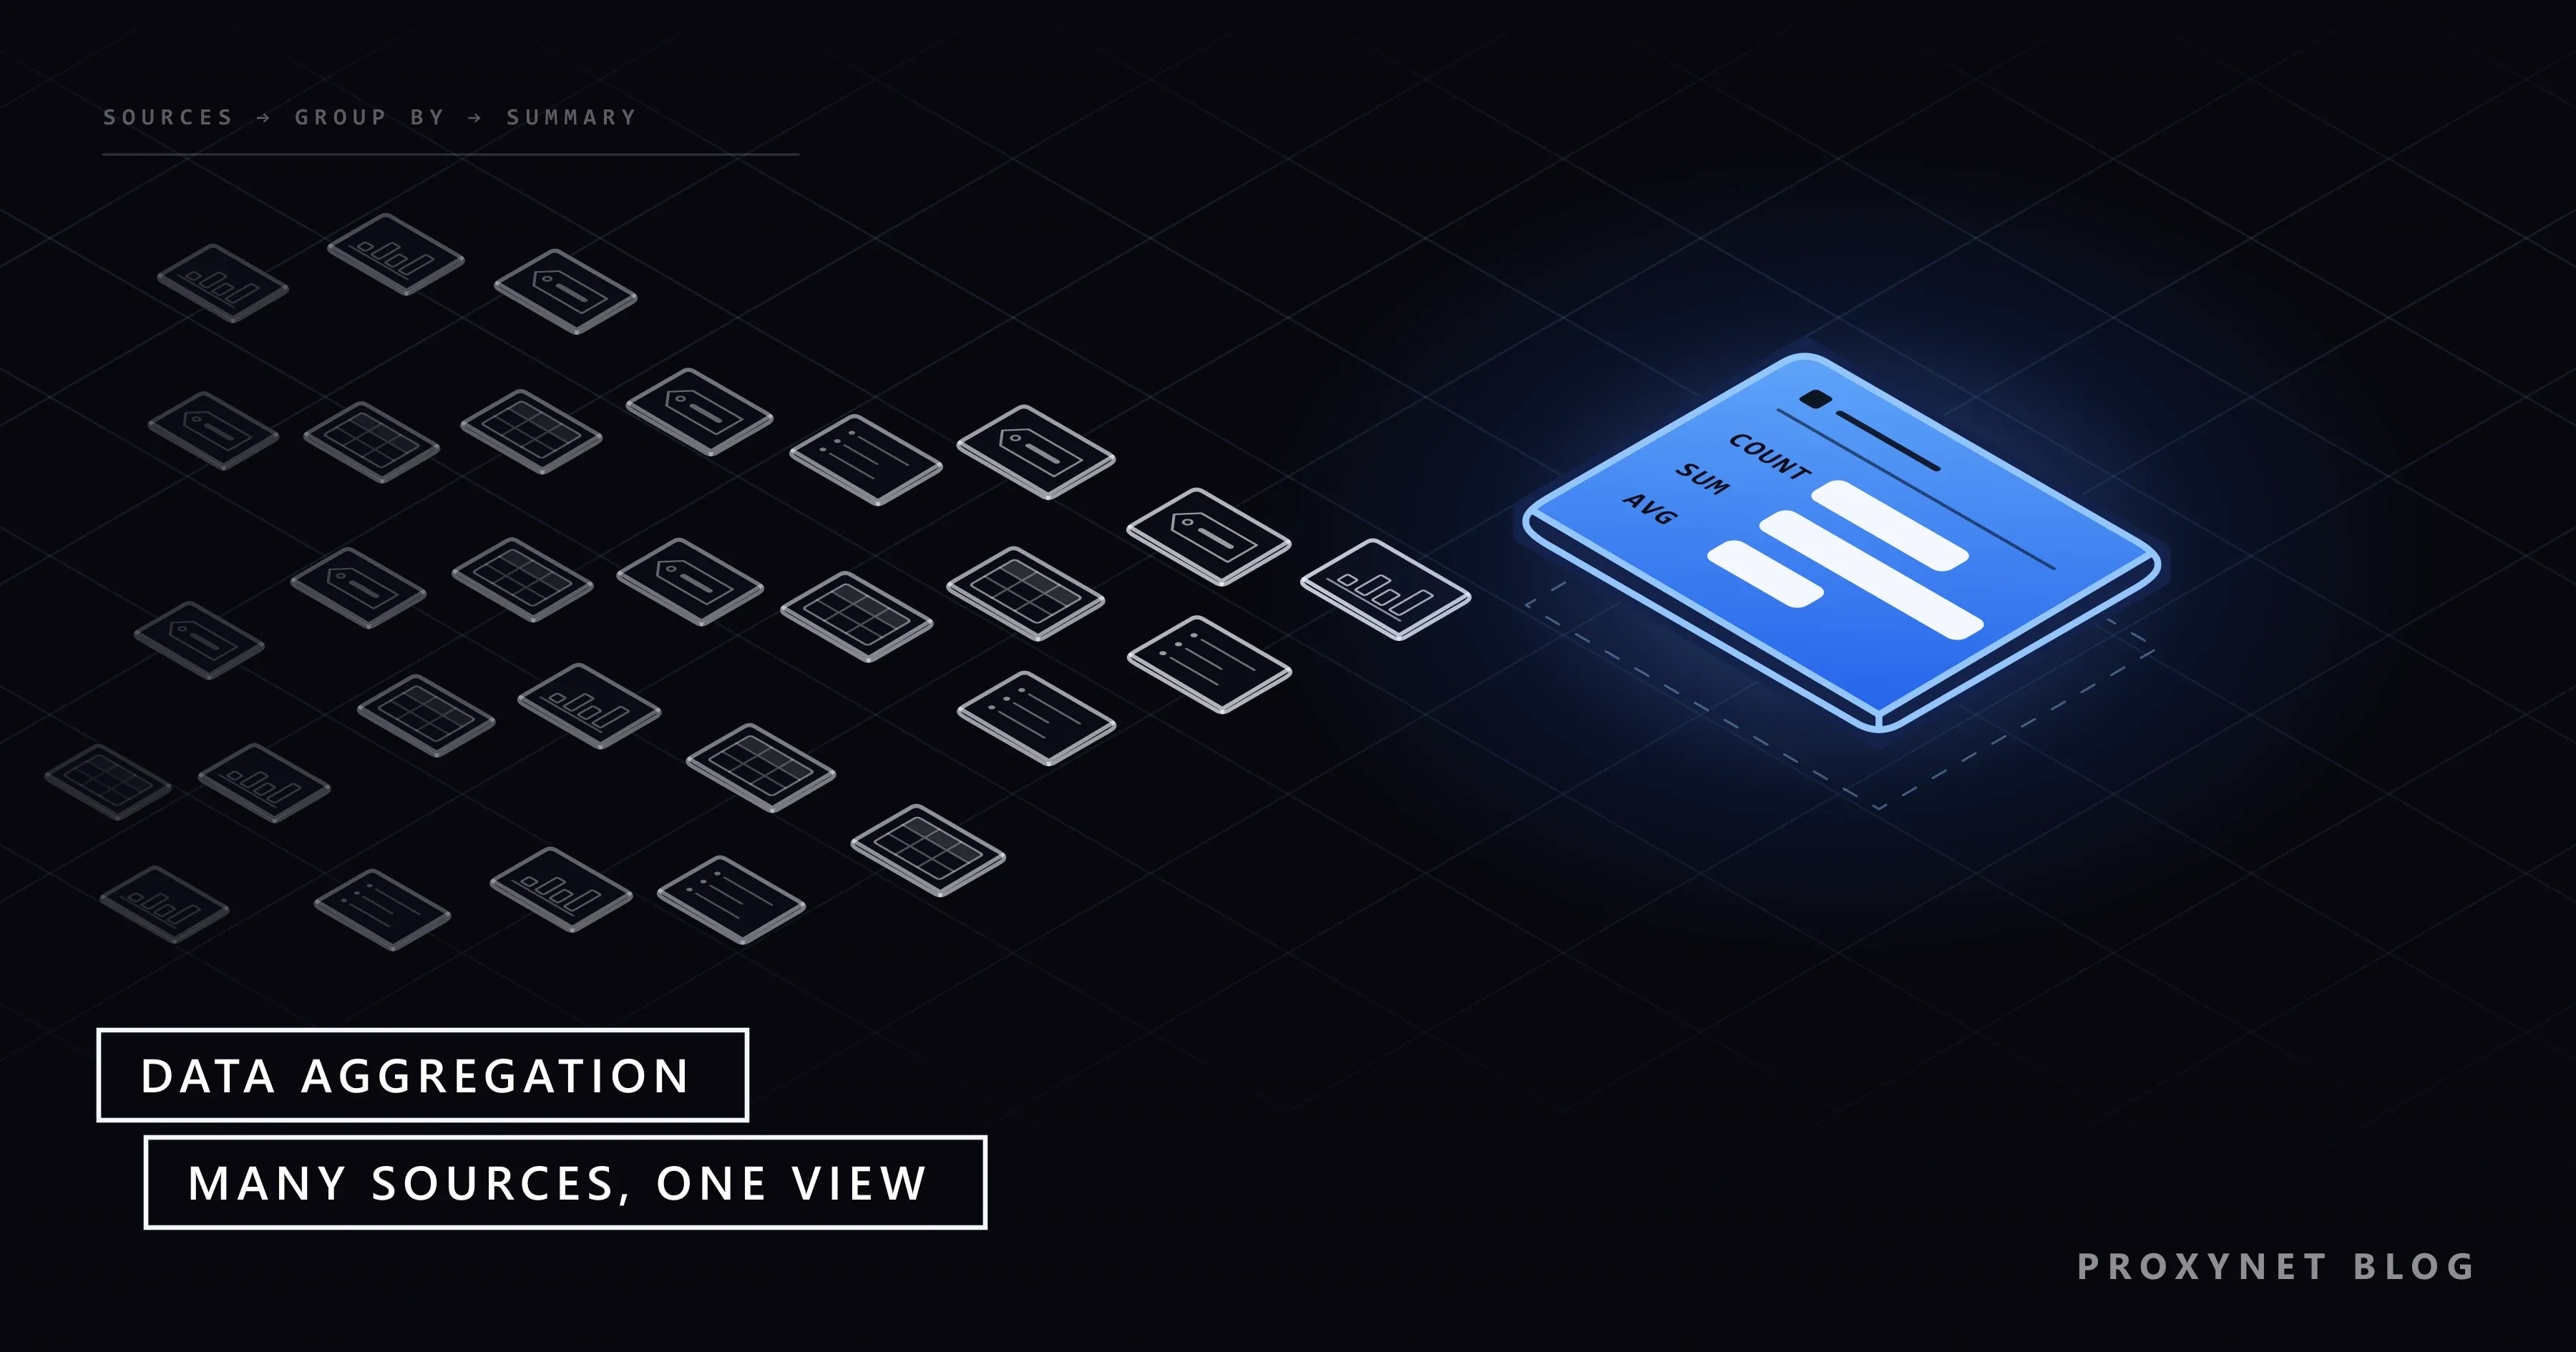
Data aggregation is combining data from several sources or many records and expressing it as a summary. The word is used in two related senses, and most real jobs involve both.
The first sense is collection from many sources: bringing records from different systems, files or websites into one dataset with one structure. A travel site showing fares from many airlines is an aggregator in this sense.
The second sense is summarizing: reducing many rows to a few values. Thousands of order lines become "1,284 orders, 52,300 euros in revenue, 40.73 euros per order" per day. In statistics and databases, aggregation usually means this second step, and the result is called aggregated data or summary data.
NIST's glossary defines aggregation simply as "the consolidation of similar or related information."
What is the difference between raw, aggregated and disaggregated data?
Raw data is the individual records as they were captured, aggregated data is a summary of those records, and disaggregated data is a summary broken back down into subgroups. Statisticians also call raw records microdata.
A list of 5,000 purchases with time, product and store is raw data. "Revenue per day" is aggregated data. "Revenue per day, split by store and category" is disaggregated data: still a summary, at a finer grain.
The grain, meaning the level of detail one row represents, is the key decision. Too coarse, and you hide the pattern you were looking for, such as one store pulling the average down. Too fine, and groups become so small that the summary reveals individuals.
How does data aggregation work?
An aggregation job brings sources into one shape, cleans them and then computes summaries per group. Seven steps cover most jobs, whether a person does them in a spreadsheet or a scheduler runs them every hour:
- Define the question and the unit. "Revenue per day per country, in euros, by order date in the shop's time zone" is a definition; "sales numbers" is not.
- Collect from each source. Exports, database queries, official APIs or public web pages, each with its retrieval time noted.
- Standardize. Convert units, currencies and time zones, and map different category names and columns to one schema.
- Match and deduplicate. Decide which records describe the same order, product or company, and keep one of each.
- Group and compute. Choose the grouping keys, such as day, country or category, and apply the aggregate functions.
- Check the result. Compare totals with a source you trust and read a few raw rows behind any odd number.
- Store and refresh. Save the summary with its definition, sources and time, and rerun it when new data arrives.
Steps 3 and 4 take most of the effort. A scheduled aggregation usually sits inside an extract, transform and load pipeline; What Is ETL? shows how such a job is built.
Which functions are used to aggregate data?
The core aggregate functions are count, sum, average, minimum and maximum, often joined by median, distinct count and percentiles. The PostgreSQL manual puts the idea in one line: an aggregate function computes a single result from multiple input rows (PostgreSQL tutorial on aggregate functions).
In SQL, the GROUP BY clause decides which rows are summarized together. This query returns one row per day and country, with the number of orders and the revenue:
SELECT order_day, country, COUNT(*) AS orders, SUM(amount_eur) AS revenue
FROM orders
WHERE status = 'paid'
GROUP BY order_day, country;
Two details trip people up. WHERE filters rows before they are grouped, while HAVING filters the groups afterwards, for example to keep only countries with more than 100 orders. And an average of averages is usually wrong: if one store has 10 orders averaging 80 and another has 1,000 orders averaging 20, the combined average is about 20.6, not 50. Recompute averages from the underlying sums and counts. Spreadsheet pivot tables do the same grouping with a different interface.
What are the main types of data aggregation?
The main types differ in what they group by: time, place, category or source. One job often combines several of them.
| Type | Groups by | Example | Watch out for |
|---|---|---|---|
| Time | Hour, day, month | Daily revenue | Time zones, partial periods |
| Spatial | Region, city, grid cell | Sales per region | Boundaries, small areas |
| Category | Product, segment, channel | Revenue per category | Mismatched category lists |
| Across sources | Shop, supplier, bank | One view of all offers | Duplicates, units |
Time aggregation rolls events up into periods: clicks per hour, orders per day, prices per week. The period changes what you see; daily data shows weekends, monthly data hides them.
Spatial aggregation summarizes data by area: points on a map become counts per postal district, city or country. The same customers grouped by district and by city can tell different stories, and a very small area may hold so few people that the summary describes one household.
Category and source aggregation groups by labels such as product type, channel or supplier. The hard part is agreeing on the labels, because two marketplaces rarely share a category tree.
Why do time zones change aggregated totals?
Time zones change aggregated totals because "a day" starts at a different moment in each zone, so orders near midnight move from one day to the next. The total over all days stays the same, but the daily figures do not.
On our test machine we put six orders into an in-memory SQLite table with UTC timestamps and summed them per day twice: once by the UTC date and once by the date in a shop that runs on UTC+3. Both versions added up to the same 240, yet the first day came out as 160 in UTC and 65 in the shop's local time, because two late-evening orders crossed midnight.
Neither number is wrong; they answer different questions. Pick one time zone for each report, write it into the definition and convert every source to it before grouping.
Manual or automated aggregation: which do you need?
Manual aggregation means a person summarizes files in a spreadsheet; automated aggregation means a scheduled job runs the same steps. It depends on how often the question repeats and how many sources feed it.
A one-off overview from four price lists is faster by hand, and a person notices odd values along the way. A daily dashboard fed by twenty sources needs automation, because hand-made copies drift and steps get skipped. Automation, though, repeats a wrong definition faithfully, so the checks from step 6 belong inside the job.
How is data aggregation different from data integration and enrichment?
Aggregation summarizes, integration connects, and enrichment completes. They often run in the same pipeline, but they answer different needs.
Data integration (sometimes called consolidation) brings data from different systems into one consistent model, record by record, without necessarily summarizing anything. A customer record that joins the CRM entry with the billing account is integration.
Data enrichment adds missing attributes to records you already hold, such as an industry code taken from a registry; What Is Data Enrichment? shows how a record is matched and completed. Aggregation then reduces those records to the figures a report needs.
What are common examples of data aggregation?
The most familiar examples are services that show you many sources at once.
Price comparison sites gather offers for the same product from many shops, match them to one product and show the lowest price, the range or the price history. Matching is the hard part: the same phone appears under different names, bundles and storage sizes.
Travel meta-search sites collect fares and room rates from airlines, hotels and agencies, sort them on one page and send you to the seller to book.
Financial account aggregation shows balances and transactions from several banks in one app. In the EU this is a regulated payment service: the Payment Services Directive (PSD2) defines an "account information service" as an online service that provides consolidated information on payment accounts a user holds with one or more other providers (PSD2 on EUR-Lex). Article 67 lets such a service act only with the user's explicit consent, read only the accounts the user designates and use the data only for the service requested.
Log and monitoring tools turn thousands of identical error lines into one entry with a count. Official statistics do the same at national scale, publishing survey and register data as tables.
Is aggregated data anonymous?
Aggregated data is anonymous only when no person can be singled out from it, and that is not guaranteed by summarizing alone. Under the EU's GDPR, data protection rules do not apply to anonymous information, including statistics, but whether data is anonymous is judged by "all the means reasonably likely to be used" to identify someone (Recital 26 of the GDPR on EUR-Lex).
Small groups are the usual problem. "Average salary of employees aged 60+ in the Lisbon office" is a summary, but if one person fits that description, it is that person's salary. Statistics offices therefore suppress or merge small cells before they publish a table.
Many summaries of the same data can also be combined to recover the rows behind them. Researchers at the US Census Bureau showed that the published tables of the 2010 Census, together with public information, were enough to exactly reconstruct 97 million person records (Abowd et al. on arXiv). For 2020 the Bureau switched to a differential privacy method, which adds calibrated statistical noise to the published figures.
The practical rules: set a minimum group size before publishing, avoid many overlapping breakdowns of the same small population, and treat a summary that still describes someone as personal data.
What does data aggregation mean in OPSEC?
In operations security (OPSEC), data aggregation means that harmless facts, combined, can reveal something sensitive. A staff list, a delivery schedule and a few public photos are each innocent; together they may show who works where and when a site is empty.
The idea is written into rules: US Executive Order 13526 allows a compilation of individually unclassified items to be classified if the combination reveals an association the items do not show on their own. For a company, the lesson is to review job ads, public documents and employee posts together, not one by one.
Where do proxies fit in data aggregation?
Proxies matter when an aggregation job reads public web sources that look different from each country. A retailer's price, stock and delivery options often depend on the visitor's location, so a comparison built from one office sees one country's version of every page; Why Do Prices Differ by Country? explains the reasons.
A Residential Proxy lets each request leave from a home connection in the country or city the data describes, at a pace the site can handle. Proxies do not change the rules: the site's terms, robots.txt and the official API, where one exists, still come first.
For catalogs on marketplaces, our e-commerce proxies are set up to read prices and stock as a local shopper sees them.
Teams that would rather not run the collection step themselves can ask our sales team about the Web Scraping API, a managed page extraction service.
Where is data aggregation used?
- Retail and e-commerce: sales per channel, price ranges across shops, stock levels per warehouse.
- Finance: account aggregation in banking apps, portfolio totals across brokers, spending by category.
- Travel: fares and room rates from many sellers on one results page.
- Marketing: campaign results summed across ad platforms.
- Operations and IT: log events and error rates per service and hour.
- Market research: competitor prices and ranges summarized by country.
Common mistakes
- Double counting. The same order in two feeds, or a refund and a new order counted as two sales.
- Mixing units and currencies. Grams with kilograms, prices with and without tax, euros next to dollars.
- Ignoring time zones. Daily totals that change depending on which clock the report uses.
- Averaging averages. Combined averages must be recomputed from sums and counts.
- Different definitions per source. One shop counts orders at checkout, another at shipment.
- Comparing partial periods. The current month set next to full months without a label.
- Publishing tiny groups. A summary of one or two people is their personal data.
- No source or time per figure. Nobody can later say which data a number was built from.
Decision guide
| Need | Recommendation |
|---|---|
| One answer from a few files, once | Spreadsheet and a pivot table |
| The same report daily from many sources | Scheduled job with built-in checks |
| Totals across time zones | Fix one zone in the definition |
| Combined average of groups | Recompute from sums and counts |
| Prices that differ by country | Collect each from its own country |
| Bank accounts in one app | Licensed account information service |
| Publishing summaries about people | Minimum group size; check the GDPR |
Frequently asked questions
What is data aggregation in simple terms?
Data aggregation is collecting data from different places and summarizing it, for example adding up sales from three shops into one daily total. The result answers a question that no single source can answer alone.
What is an example of data aggregation?
A price comparison site is a common example: it gathers offers for the same product from many shops and shows the lowest price. A daily sales report across shops and a banking app showing several banks are others.
What is data aggregation in SQL?
In SQL, data aggregation means using aggregate functions such as COUNT, SUM, AVG, MIN and MAX, usually with GROUP BY, to turn many rows into one row per group. HAVING then filters the grouped results.
What does data aggregation mean in OPSEC?
In OPSEC, data aggregation is the risk that pieces of information, harmless on their own, reveal something sensitive once they are combined. Organizations review what they publish together, not item by item, for that reason.
Is aggregated data personal data under the GDPR?
Aggregated data falls outside the GDPR only if it is truly anonymous, meaning no person can be identified with means reasonably likely to be used. Summaries of very small groups can still identify people and then remain personal data.
What is the difference between data aggregation and data integration?
Data integration connects data from different systems into one consistent model, record by record. Data aggregation summarizes records into totals, averages or counts. Integration usually comes first, so that the aggregation works on matched and cleaned records.
Summary
Data aggregation turns many sources and rows into one view: collected, cleaned, grouped and summarized. Most of the work is preparation, because duplicates, mixed units and time zones distort totals without raising an error. Summaries of people are not automatically anonymous, so small groups need care. And when the sources are public web pages that change by country, collect each market's data from that market, through a proxy located there.